Evidence: First-hand data
Last checked: 11 October 2026
What was done: Every figure was read from WordPress, Google Search Console, Google Analytics 4, PageSpeed Insights or MailerLite between 3 and 11 October 2026. Where a sentence is my interpretation and not a measurement, it says so.
Files: The numbers in a Google Sheet and the test files on GitHub
Affiliate links: No
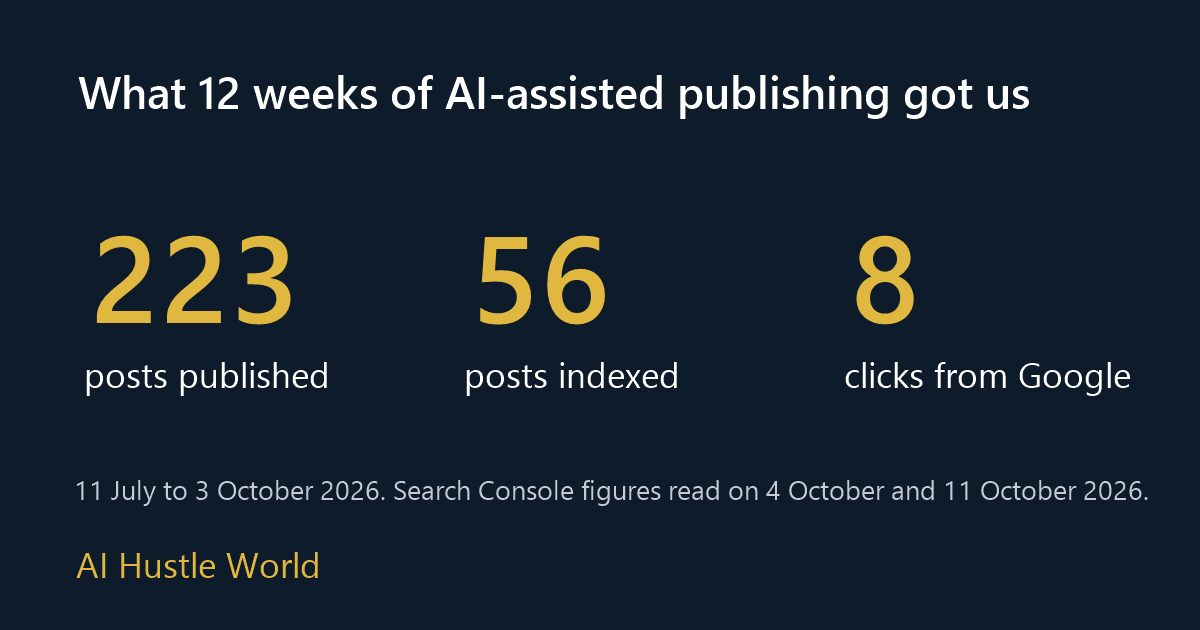
Between 11 July and 3 October 2026 I published 223 posts on AI Hustle World. Every one was drafted with AI assistance and edited to a fixed template. On 4 October I opened Google Search Console and counted what that work had earned. 56 of the 223 posts were in Google’s index. In three months Google had sent the site 8 clicks, and all but one of them landed on the homepage.
This post is the full account: what I did, what happened, what I checked and ruled out, what I think went wrong, and what I changed in the first eleven days of October. I am publishing the numbers because a site that asks readers to trust its research should show its own results first.
Two notes before the numbers. First, I do not know why Google behaved as it did, and Google does not say. Where I give a reason, it is my reading of the evidence, and I mark it as that. Second, the audit behind this post and most of the edits that followed were done with an AI assistant working in my browser under my direction. The decisions, the listening tests and the indexing requests were mine.
Table of Contents
- The Numbers in One Table
- What I Did: 223 Posts in 12 Weeks
- What Google Did With It
- What Readers Did
- What I Ruled Out
- How to Run the Same Check on Your Own Site
- What I Think Went Wrong
- What I Changed in October
- What the First Tests Found
- What Has Changed in the Numbers So Far
- What I Have Not Fixed
- What I Would Do Differently From Day One
- What the Old Method Would Have Cost if I Had Kept Going
- Why the High-Volume Method Exists
- What I Will Report Next
- Final Thoughts
- Frequently Asked Questions
The Numbers in One Table
| Measure | Figure | When |
|---|---|---|
| Posts published | 223 | 11 July to 3 October 2026 |
| Days with at least one new post | 82 of 85 | 11 July to 3 October 2026 |
| Words published | 1,645,369 | Counted on 3 October |
| Average words per post | 7,378 | Counted on 3 October |
| Posts in Google’s index | About 56 | 4 October |
| URLs Google knew about but had never fetched | 173 | 4 October |
| Clicks from Google Search | 8 | 11 July to 8 October |
| Clicks that reached an article | 1 | 11 July to 8 October |
| Other sites linking to us, as Google counts them | 1 | 4 October |
| Newsletter subscribers | 7 | 4 October |
| Posts showing first-hand use of the product they covered | 0 | 3 October |
Every row comes from a tool I can open and show you. The full set is in a Google Sheet, with the date each figure was read and the tool it came from. The rest of this post explains the rows in order.
What I Did: 223 Posts in 12 Weeks
The first post went live on 11 July 2026 and the 223rd on 3 October, twelve weeks later to the day. I published on 82 of those 85 days. The average was 2.7 posts a day, and on 31 August I published seven.
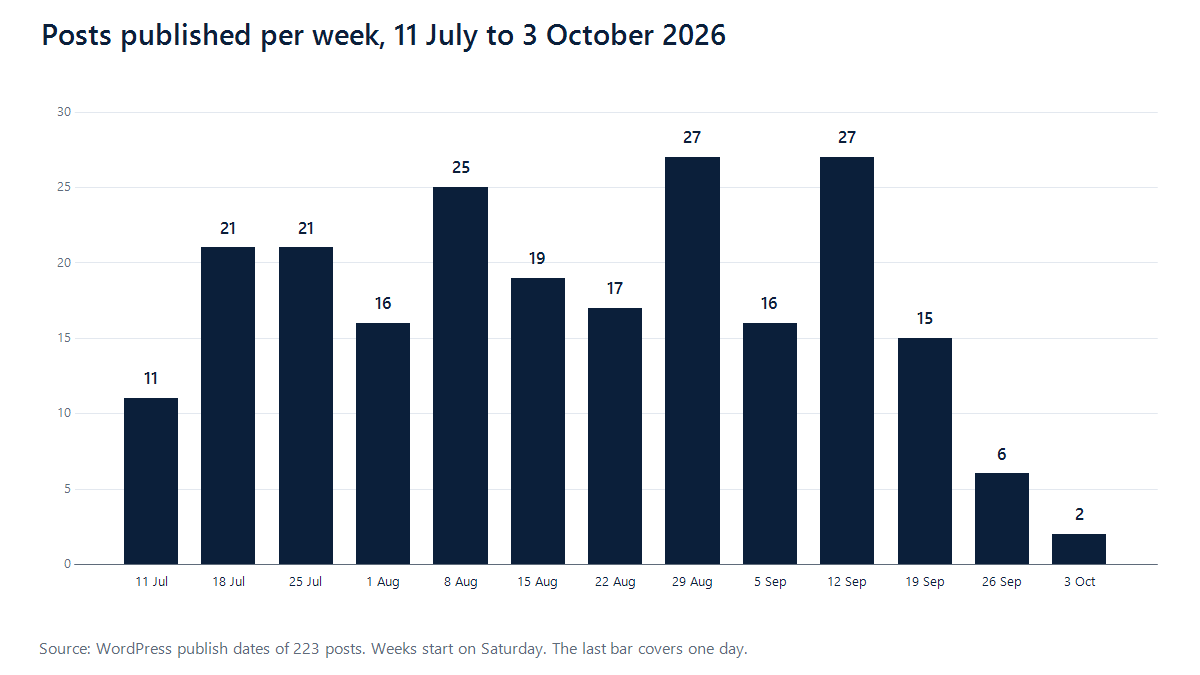
The posts were long. The shortest ran to 4,681 words and the longest to 13,923, and 197 of the 223 passed 6,000 words. In total that is 1.6 million words in twelve weeks, far more than I could have researched and written alone at that pace. I did not write them unaided. Each post was drafted with AI assistance and then edited against a checklist for structure, sources and tone.
The topics were broad. By 3 October the site had 16 categories, covering AI tools, explainers, guides, productivity, business, governance, e-commerce, finance, coding, content repurposing, legal work, cybersecurity, product management and HR. It also had 692 tags, about six for every post.
In the last week of September I revised almost everything at once. WordPress shows that 185 of the 223 posts were modified between 26 and 30 September, and 82 of them on a single day. I mention it because it matters later. Google had not fetched any indexed page since 22 September, so it had seen none of that rewrite when I ran the numbers.
Because the posts came from one checklist, they shared one skeleton. The chart below counts how many of the 223 posts contained the same section heading. A reader who opened three posts in a row would have met the same Table of Contents, the same Final Thoughts and the same FAQ block each time, whatever the topic.
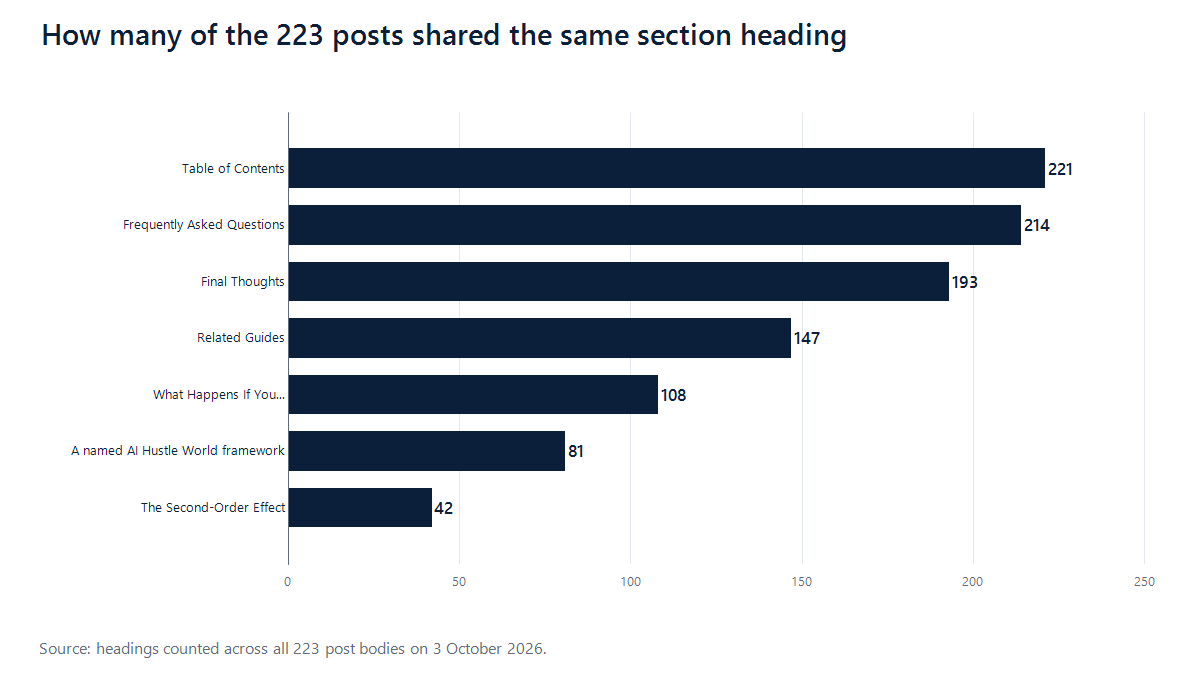
The average post had 38 second-level headings and 26 third-level headings, which works out at one heading for roughly every 115 words. The ElevenLabs review was about 60 phone screens long. None of this is hidden. Anyone, or anything, that reads two of these pages can predict the layout of the next two hundred.
What Google Did With It
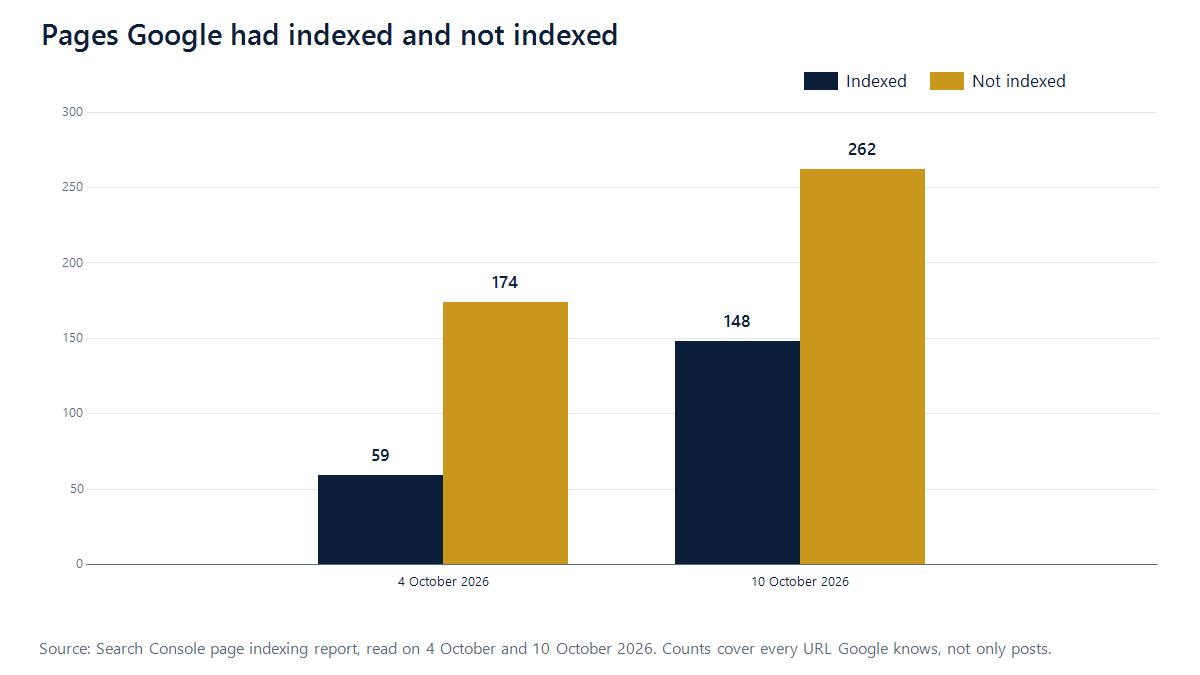
Search Console’s page indexing report on 4 October listed 233 URLs for the site. 59 were indexed and 174 were not. Of the 174, 173 carried the status that Google calls “Discovered – currently not indexed”, and each one showed “Last crawled: N/A”. In plain terms, Google knew those addresses existed and had never requested them.
Google’s own description of that status is that it knows about the page but has not crawled it yet. The 173 included 148 posts: 17 from July, 72 from August and 59 from September. The 59 indexed URLs were the homepage, the contact page and about 56 posts, almost all of them from the first weeks of July or from a five-day stretch in late August.
One detail in that report changed how I read the whole problem. On 4 October there was not a single page that Google had fetched and then declined to index. Every page it had read, it had kept. The pages it left out were pages it had never opened. So the first question was not “why does Google dislike these pages?” It was “why has Google stopped coming to look?”
The crawl statistics pointed the same way. In 90 days Google made about 1,130 requests to the site. Images took 58 percent of them, and only about 200 requests were for article pages. Almost every request was a refresh of something Google already had, and less than one percent was discovery of something new.
Search results followed from that. Between 11 July and 8 October the site appeared in Google results 360 times and was clicked 8 times. Counted by page, the homepage and its older address variants took every click except one, which went to an article in July. In the month to 3 October only 40 of the 223 posts were shown in a search result at all, and the most visible one was shown 18 times.
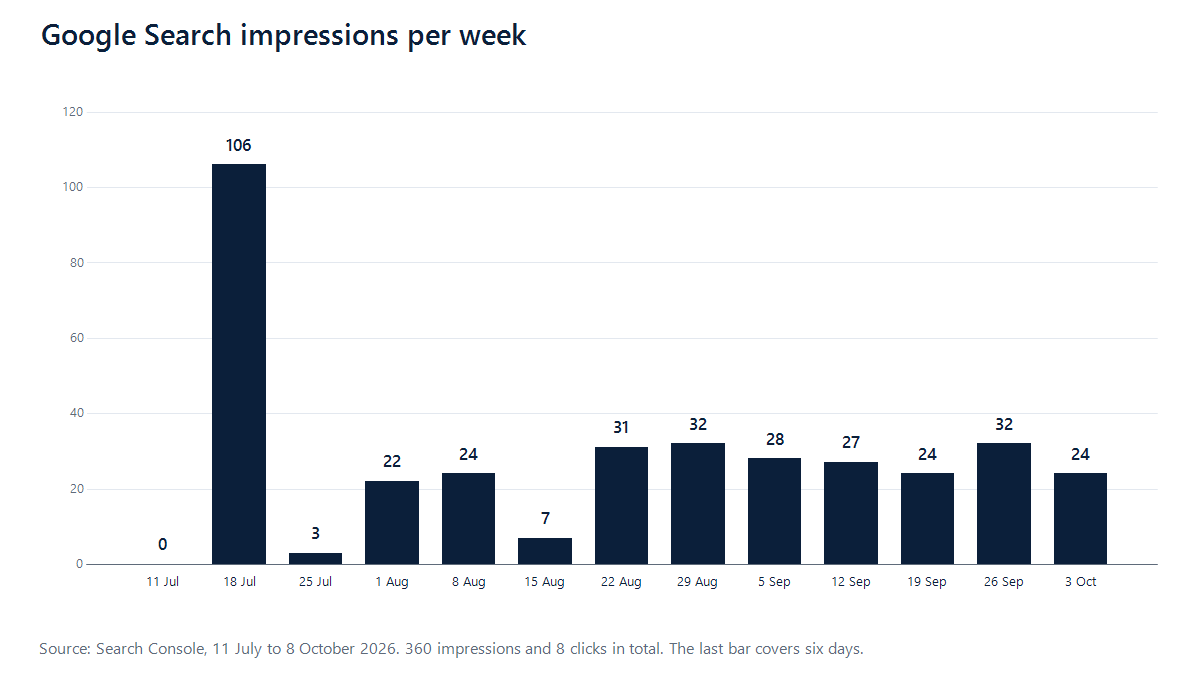
The weekly chart has one odd bar. The week of 18 July accounts for 106 of the 360 impressions, at average positions between about 40 and 55, and nothing like it happened again. After that the site settled at 20 to 30 impressions a week, which is close to nothing for a library of that size.
What Readers Did
Google Analytics tells the reader’s side. In the four weeks to 3 October the site had 326 active users, and 323 of them were new. The average engagement time was 12 seconds per user. A post of 7,000 words takes about half an hour to read, so almost nobody who arrived was reading.
Where those visits came from matters as much as how short they were. Of 340 sessions, 291 were direct, which means no referring site and no search. Google search sent 14, Pinterest 14, Bing 6 and LinkedIn 4. A site built to be found through search was getting under seven percent of its visits from search engines.
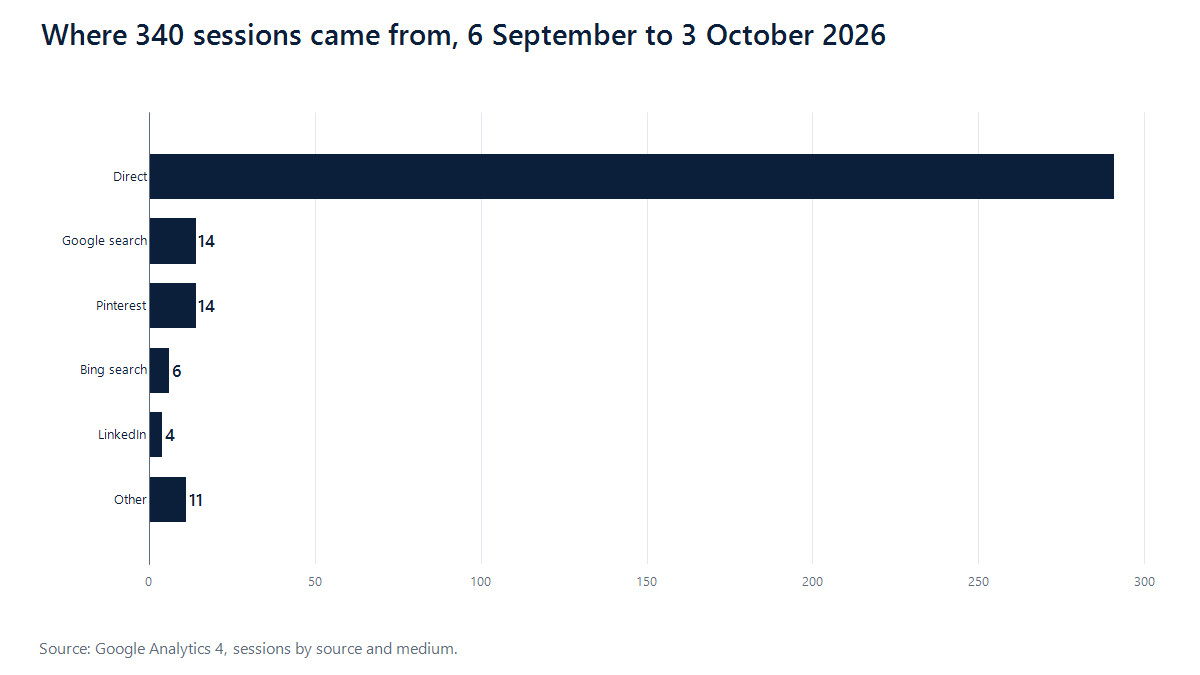
The other channels told the same story at smaller scale. Pinterest showed the pins 4,120 times in 30 days and sent 4 clicks. The newsletter had 7 subscribers, no sign-ups in the previous 30 days and no email ever sent. Google’s links report listed one external link to the whole site, from LinkedIn to the homepage.
Read together, and this part is interpretation, those figures do not describe an audience. A large direct share with 12 seconds of engagement is more consistent with the owner’s own visits, shared links opened briefly, and automated traffic, although Analytics cannot tell me the split. By 3 October the site had 1.6 million words and, as far as I can measure, almost no readers.
What I Ruled Out
Before deciding the content was the problem, I checked the mechanical causes, because they are cheaper to fix and easier to prove.
| Possible cause | What I checked | Result |
|---|---|---|
| Slow pages | PageSpeed Insights, mobile, on 4 October | Performance 97 on an article and 98 on the homepage |
| A Google penalty | Search Console manual actions and security issues | None of either |
| A broken sitemap | Search Console sitemaps report | Read successfully on 3 October, 245 pages discovered |
| Pages blocked from Google | robots.txt, robots tags and canonical tags on all 220 posts in the sitemap | Nothing blocked. Every post was indexable and pointed to itself as the canonical version |
| Server trouble | Search Console crawl statistics, host status | No host problems reported |
So the site was fast in a lab test, not penalised, not blocked and correctly listed. One mechanical point was not clean. Google’s crawl report showed an average response time of 1.61 seconds, and 386 of the site’s images were PNG files of 1.2 to 2.2 megabytes that had never been converted to a lighter format. Images were taking most of Google’s requests. I count that as a real fault, and it is being fixed. It does not explain 173 pages that were never requested once.
Ruling these out left one explanation. Google had sampled the site, kept what it read, and then chosen to spend almost no further effort on it.
How to Run the Same Check on Your Own Site
If you publish with AI assistance and want to know where you stand, the same check takes about ten minutes and needs only Search Console.
- Open the page indexing report and note two numbers: indexed and not indexed.
- Open the reasons for not indexed. “Discovered – currently not indexed” means Google has not fetched the page. “Crawled – currently not indexed” means it fetched the page and did not keep it. They are different problems with different fixes.
- In the discovered list, look at the last-crawled column. A date means Google came once. No date means it never has.
- Open Settings, then Crawl stats, and look at requests by purpose. If almost everything is refresh and almost nothing is discovery, Google is maintaining what it has and not looking for more.
- Write the numbers down with the date, and repeat in a week.
On my site the answers were 59 and 174, nearly all never fetched, and less than one percent discovery. Your numbers will tell you which problem you have before you spend a day fixing the wrong one.
What I Think Went Wrong
This section is my reading, not a measurement. Google has not told me anything, and I have no way to test one cause in isolation. What I can do is line the site up against what Google publishes about content and see where it fits badly.
Volume without evidence
Google’s spam policies describe scaled content abuse as producing many pages mainly to influence rankings and not to help people, and they say it applies however the pages are made. Its guidance on helpful content asks whether a site shows first-hand knowledge, such as having used the product it writes about, and whether it is publishing large amounts of content on many topics in the hope that some of it ranks. I did not set out to manipulate anything. But 2.7 long posts a day across 16 categories, with no first-hand use in any of them, is hard to tell apart from that description when seen from outside.
A promise the pages did not keep
On 4 October the homepage carried a section headed “Built on Testing, Not Hype”. Not one of the 223 posts showed first-hand use of the product it covered. The ElevenLabs review said in its own text that it did not claim hands-on testing, and then gave the product a score of 86.9 out of 100. A score to one decimal place with no test behind it is the kind of detail that makes a careful reader stop trusting the rest.
Pages that competed with each other
Some topics were covered several times over. There were nine pages about one advertising tool: a review, a pricing page, a free trial page, a small business page, a Shopify page, two comparisons, an alternatives page and a cancellation guide. There were five overlapping pages about one customer support tool, and between them they quoted three different figures for the same vendor claim. Seven other pairs of posts answered the same question twice.
No reason for anyone to link
Google counted one external link to the site. Nothing on it gave another writer a reason to cite it, because nothing on it was original. There was no test, no dataset and no figure that could not be found on the vendor’s own page. A site with one link and 223 new long pages is asking a search engine to take a great deal on trust.
Too much, too fast, for a new site
The site was twelve weeks old. It was adding pages faster than Google was fetching them, and the pages Google did fetch looked alike. I cannot prove that Google slowed its crawling because of what it sampled. The timing fits, though. The indexed pages were almost all early ones, and Search Console shows that the 173 unfetched addresses were first noticed on 5 September, after eight weeks of the same pattern.
What I Changed in October
I stopped publishing on 3 October. Apart from this account, no new post has gone out since, and none will until the existing ones are in order. The work of the first eleven days of October falls into five groups.
Fewer pages, each with one job
Fifteen posts were merged into stronger pages and redirected, which took the site from 223 posts to 208. The nine pages about the advertising tool became three. The five about the support tool became three that agree with each other. The seven duplicate pairs became seven single pages. I also removed all 692 tags, because each tag had its own archive page and none of them helped a reader.
A label on every post
Every one of the 208 posts now opens with an evidence box. It says whether the page is hands-on tested or written from documentation, the date it was last checked, what was done, where the files are, and whether the page has affiliate links. On all but three posts the honest label is that the page was written from documentation, and that is what the box says. The unsupported score on the ElevenLabs review is gone. The research methodology page states how each label is earned, and it sits beside the editorial policy and the corrections policy.
Pages that are easier to read
Article pages lost the empty sidebar that took a third of the screen. They gained visible breadcrumbs and a date that shows the last update. Comments are closed, because on the pages I checked they held only automatic pingbacks from my own posts. Three pages that should have existed from the start now do: Start Here, a newsletter page and an affiliate disclosure.
Lighter images and a cleaner sitemap
The oversized images are being converted to WebP in batches, and that job is not finished. The sitemap no longer lists every image separately, which had added hundreds of entries with no benefit. The thirteen oldest posts had images with no stated size, so the page jumped while it loaded, and those images now carry their dimensions.
The first real tests
The change that matters most is the smallest in volume. I wrote a pack of 12 script lines, six in English and six in mixed Bengali and English, and ran it through three voice tools on their free plans. I listened to every take myself, and every take was logged with the usage each tool charged. The scripts, the log and dated screenshots are in a public folder on GitHub.
What the First Tests Found
| Test | Date | Result |
|---|---|---|
| 12 lines in ElevenLabs, Eleven v4 | 8 October | 12 of 12 correct on the first take. About $0.13 per finished minute |
| 12 lines in Cartesia, Sonic 3.6 | 11 October | 12 of 12 correct on the first take. About $0.05 per finished minute. Needed two voices |
| 12 lines in Murf | 11 October | 12 of 12 correct on the first take. About $0.24 per finished minute for one pass |
| ElevenLabs voice clone on the Free plan | 10 October | Blocked at the last step by an upgrade screen |
| One 66-second clip dubbed from English to Hindi | 11 October | Name, price and date right. Web address partly right |
Three things in those results are worth more to a reader than anything in the 1.6 million words that came before. ElevenLabs’ pricing page lists voice cloning from the Starter plan, but the Free account showed the cloning button with no lock on it, let me record a sample and fill in the form, and asked for payment only when I pressed save. Murf changed its voice style to “Angry” on its own when a block was switched to Bengali, and it went unnoticed until the run was over. And one company the site had recommended as an alternative had stopped selling voice generation altogether. Nothing in the old post could have caught that. Opening its product page on the day did.
The tests also showed what the old method cannot produce. All three tools read every line correctly, so on accuracy there was nothing to choose between them. The differences that would decide a purchase were the number of voices needed, the cost per finished minute and a setting that moved by itself. None of those is on a pricing page. The full results are in the ElevenLabs review, the comparison of ElevenLabs and its alternatives, the dubbing guide and the voice cloning guide.
None of this cost money. Every test ran on a free plan, and the limits of those plans are part of the findings. One tool allowed no downloads. One charged a third of its monthly free allowance for a single minute of dubbing. None allowed the audio to be published.
These are small tests: 12 short lines, one listener and free plans. No audio is published, because the free plans do not allow commercial use. Three articles out of 208 now carry a hands-on part. That is 1.4 percent of the site. It is also three more than on 3 October.
What Has Changed in the Numbers So Far
| Measure | 6 October | 10 October |
|---|---|---|
| Indexed URLs | 59 | 148 |
| Not indexed URLs | 174 | 262 |
| Search impressions, previous 28 days | 106 | 106 |
| Search clicks, previous 28 days | 4 | 3 |
| External links Google knows about | 1 | 4 |
| Newsletter subscribers | 7 | 8 |
The indexed count rose from 59 to 148 in six days. I cannot tell how much of that came from the edits and how much from asking. Since the first week of October I have requested indexing for ten pages a day by hand, through Search Console’s URL inspection tool, and before that the report had not moved since early September. Of the first ten addresses I requested, one was indexed two days later.
The not-indexed count rose too, from 174 to 262. That needs explaining, because it looks like bad news and mostly is not. Google now knows about 410 addresses where it knew 233, and many of the new ones are addresses that now redirect.
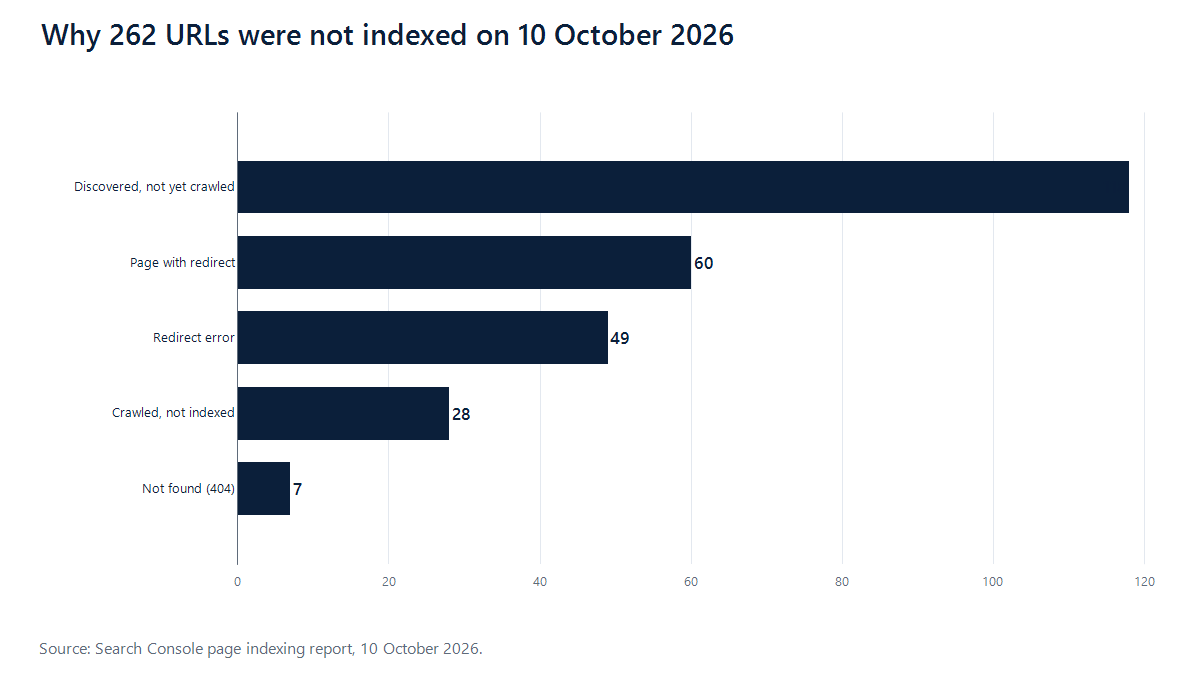
Sixty of the 262 are pages with a redirect, which Google’s documentation says it does not index because it indexes the destination. Seven are addresses that no longer exist. The number that matters most fell: pages discovered but never fetched went from 173 to 118. Two numbers are new and both need watching. Twenty-eight pages have now been fetched and not indexed, which had not happened once before October. And 49 addresses show a redirect error, which I have not investigated yet. It is the next thing on my list.
Update, 13 October 2026: the same report now shows 180 indexed and 230 not indexed, and I have looked at the redirect errors. Search Console lists 50. The eleven I tested are all old addresses of posts, most of them on the www version of the domain with shorter titles, and each one now redirects in a single step to the right page. They look like records of an earlier state of the site, not a live fault. The next step is to ask Google to check them again.
Traffic has not moved. Impressions over 28 days were 106 on 6 October and 106 on 10 October, and clicks went from 4 to 3. That is what I would expect this early. Being indexed is permission to appear in results. It is not a reason to be chosen.
What I Have Not Fixed
An honest account has to include the list of things that are still wrong.
- 205 posts are still written from documentation only. The label says so, but a label is not a test.
- Most posts still carry the long template and the repeated headings described above. Only the four voice pages have been rebuilt.
- The image conversion is unfinished.
- The 49 redirect errors in Search Console are not yet explained.
- Three other posts still presented the company that left the voice market as if it were an option. They were corrected on 13 October 2026.
- The voice cloning guide could not be tested, because cloning needs a paid plan and the tests so far have used free plans only.
I list these so that the next report can be checked against them.
What I Would Do Differently From Day One
If I started the site again tomorrow, knowing what these twelve weeks produced and what the last eleven days showed, I would change five things.
- Test before publishing. One tool, one script, one log. A page with a small real test gave me more to say than a page with ten thousand words of summary.
- Publish at the pace I can check. Two or three posts a week about products I have used, not two or three a day about products I have read about.
- Stay in one subject until it is covered properly. Sixteen categories in twelve weeks meant no subject had depth, and no reader had a reason to come back.
- Label every page from the first day. Adding the evidence box to 208 posts afterwards was a large job. Had it been there in July, it would have shown me that every label said the same thing.
- Write down the numbers every week. I had no weekly record. A row in a sheet each Saturday would have shown the stall in early September, a month before I acted on it.
None of this is new advice. The difference is that I now have my own numbers for what happens when it is ignored.
What the Old Method Would Have Cost if I Had Kept Going
It is worth being exact about why stopping was the right call, because the old method looks productive from the inside. The post count goes up every day.
At 2.7 posts a day the site would have reached about 300 posts by the end of October and more than 450 by the end of the year. Nothing in the data suggests Google would have fetched them. The count of never-fetched pages had already grown to 173, and each new post joined that queue.
There is a second cost that is easier to miss, and this is my reading of it. The 56 indexed posts were the site’s only standing with Google, and every unread, look-alike page added around them made the whole site look more like a content farm. A reader who lands on a good page and then clicks through to a thin one stops trusting both. Volume did not only fail to help the weak pages. It put the better pages at risk.
The commercial case had the same hole. Thirty-one posts carried affiliate links. With 8 clicks from Google in three months, almost nobody was there to follow them, so the reason for writing those pages in volume never arrived either.
Why the High-Volume Method Exists
I do not think the idea behind it is foolish, and it helps to say why it is tempting.
Search has long rewarded coverage. A site that answers every question around a subject tends to be treated as an authority on it, and the common advice for years was to map every keyword in a niche and publish a page for each. AI drafting removes the old limit on that plan, which was the time it takes to write. One person can now publish in a week what once took a team a quarter.
What the plan leaves out is that coverage was always a sign of something else: that the site knew its subject. When writing was slow, a hundred pages on one topic was fair evidence of that. When drafting is instant, a hundred pages are evidence of nothing, and a search engine has every reason to look for a different sign. Google’s published guidance names the one it wants, which is first-hand experience and original information. My site had the coverage and none of the sign.
What I Will Report Next
I record one row of numbers every Saturday: indexed pages, not-indexed pages, impressions and clicks for the previous 28 days, external links and subscribers. The figures so far are in the sheet linked at the top of this post.
On 20 October I will check the ten test addresses I asked Google to index on 6 October and record how many are in the index. I will also report what the 49 redirect errors turned out to be.
New articles will start again only when each one can carry a test of its own. I would sooner publish one page a week that I can stand behind than go back to seven in a day. I will publish a follow-up to this post with the same table, whatever the numbers say.
Final Thoughts
The short version is this. I published 223 long posts in twelve weeks with AI assistance. Google indexed about a quarter of them and sent 8 clicks. The site was fast, clean and unpenalised. What it lacked was any evidence that I had used the things I wrote about.
The first eleven days of work have not fixed that, and I am not claiming a recovery. What has changed is that the site now says plainly what each page is, three pages contain tests anyone can check, and there is a weekly record that will show whether any of it matters. If you are about to start a site the way I started this one, the numbers above are yours to use.
See Whether the Numbers Move
The AHW Test Log goes out when a new test or data update is published. Each email says what was checked and links to the sources.
Join the AHW Test Log →Frequently Asked Questions
How many posts did AI Hustle World publish, and how many did Google index?
223 posts between 11 July and 3 October 2026. On 4 October Search Console showed 59 indexed URLs, of which about 56 were posts. By 10 October the indexed count had risen to 148 URLs.
Does Google penalise AI-assisted content?
Google’s spam policies say the problem is content produced at scale mainly to influence rankings, however it is made. This site had no manual action. What I measured was not a penalty. It was a lack of crawling: 173 URLs were known to Google and never fetched.
What does “Discovered – currently not indexed” mean?
Google’s help page says it knows the page exists and has not crawled it yet. In Search Console those pages show no last-crawled date. On 4 October that status covered 173 of this site’s URLs, and on 10 October it covered 118.
Was site speed the reason pages were not indexed?
No. PageSpeed Insights gave a mobile performance score of 97 for an article and 98 for the homepage on 4 October. The crawl report did show oversized images and a 1.61-second average response time, which is being fixed, but that does not explain pages that were never requested.
Was there a manual action or a security issue?
No. Search Console showed no manual actions and no security issues on 4 October.
Did you delete the posts Google ignored?
No. Fifteen posts that duplicated others were merged into stronger pages and redirected. The other 208 are still live, each with a label that says how it was produced.
What is the evidence box?
A short panel at the top of every post. It states whether the page is hands-on tested or written from documentation, when it was last checked, what was done, where the files are, and whether the page has affiliate links.
Why did the number of not-indexed pages go up after the fixes?
Because Google learned about more addresses. The total it knows went from 233 to 410. Sixty of the not-indexed addresses are redirects, which Google does not index by design, and the count of pages it had never fetched fell from 173 to 118.
Did asking Google to index pages by hand work?
Partly. Of the first ten addresses I requested, one was indexed two days later. The indexed total rose from 59 to 148 in six days while I was making ten requests a day, but I cannot separate the effect of the requests from the effect of the other changes.
Where can I see the data and the test files?
The figures are in a Google Sheet, with the date each one was read. The scripts, logs and screenshots for the voice tests are in a public GitHub folder.
Get Smarter With AI
Enjoyed this guide? Get practical AI tools, tutorials, and honest reviews delivered to your inbox.