Evidence: Documentation reviewed
Last checked: August 2026
What was done: Written from official documentation and the published sources linked in this article. Not hands-on tested.
Files: None
Affiliate links: No
Last Update: August 2026
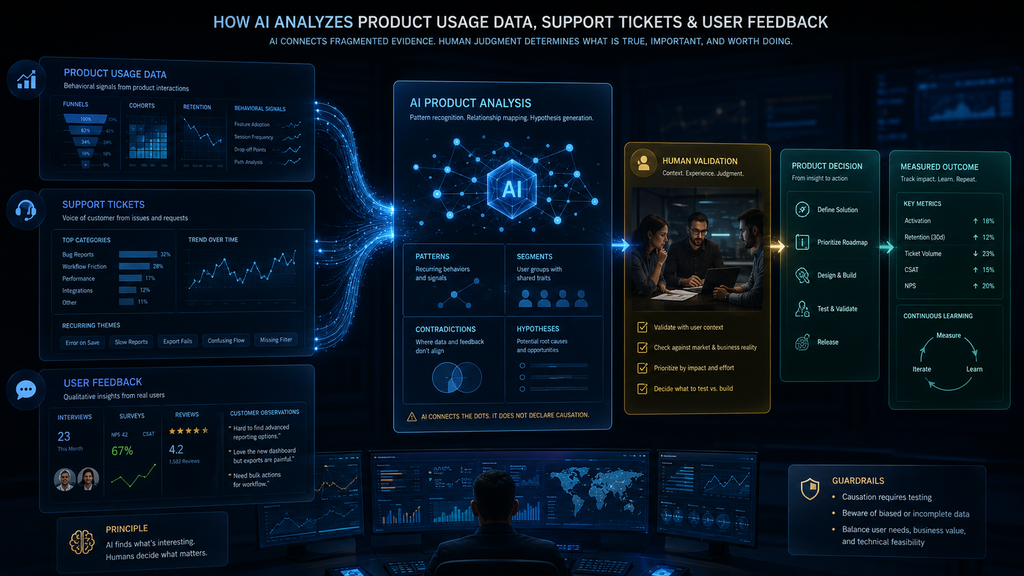
How AI Analyzes Product Usage Data, Support Tickets & User Feedback
Product teams rarely suffer from a lack of information anymore.
They have product analytics showing funnels, adoption, retention, and feature usage. Support teams have thousands of conversations describing bugs, confusion, failed workflows, and requests. Customer research produces interviews and usability observations. Surveys, reviews, sales calls, and community discussions add still more signals.
The harder problem is connecting all of it.
A dashboard can show that activation fell. A support ticket can show that a customer could not complete onboarding. An interview can reveal that the permission request felt unexpected. A release log can show that the onboarding flow changed two days before the metric moved.
Each piece matters. None necessarily explains the whole problem on its own.
That is where AI is becoming useful in product analysis.
Modern product analytics platforms are increasingly adding AI to behavioral analysis, while customer-feedback platforms are using AI to organize and synthesize qualitative information across support, research, surveys, reviews, and other channels. The broader product-management guidance is also moving toward combining quantitative behavioral signals with qualitative customer evidence rather than relying on a single source.
But there is an important distinction.
AI can make it much faster to find patterns and connect evidence. It cannot automatically turn a correlation into a proven explanation.
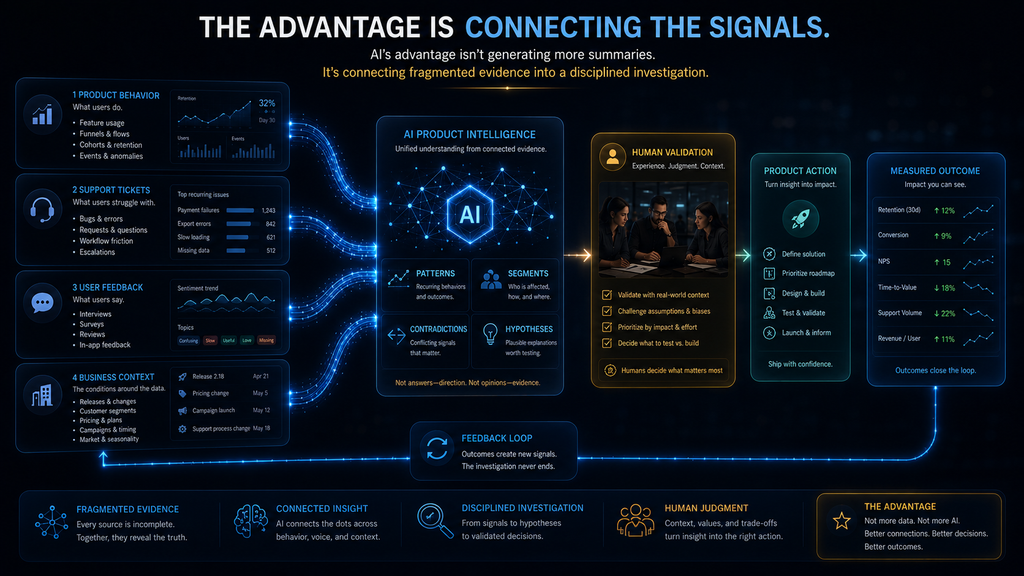
The real opportunity is therefore not simply asking AI to “analyze our product data.” It is using AI to help product teams move from: Signal → pattern → context → hypothesis → validation → action while keeping human judgment responsible for the decisions that follow.
What AI Product Data Analysis Actually Means
AI product data analysis is the use of AI to examine behavioral product data alongside customer and operational evidence in order to identify patterns, anomalies, relationships, and potential explanations that deserve investigation. That sounds straightforward, but it changes an important part of the traditional product-analysis workflow.
Historically, a product manager might investigate a problem by moving between several systems. Product analytics might reveal a drop in a funnel. The PM then searches support tickets, checks recent customer interviews, asks engineering about releases, reviews session recordings, and compares the result with different customer segments.
The difficulty is not necessarily the individual analysis. It is the fragmentation of evidence.
Atlassian’s current customer-feedback guidance makes this distinction clearly: direct feedback can come from surveys, interviews, support conversations, sales calls, and feature requests, while indirect signals include product usage patterns, churn indicators, adoption trends, reviews, and product analytics. It argues that teams get a clearer picture when they combine these different forms of evidence.
AI can help reduce the manual work involved in making those connections. It can classify thousands of conversations, identify semantically related complaints, compare patterns across cohorts, summarize recurring themes, and help analysts connect a behavioral change with relevant qualitative evidence.
That does not make AI the final decision-maker. It makes AI an increasingly useful investigation layer between raw product signals and human product judgment.
Product Usage Data Shows What Users Actually Do
Product usage data is one of the strongest sources of evidence because it measures behavior rather than asking users to remember or describe what they did. Depending on the product, this can include:
- feature adoption
- activation
- conversion
- retention
- churn
- funnel progression
- workflow completion
- session behavior
- repeated actions
- time between events
- cohort behavior
- feature usage by customer segment
Product analytics is fundamentally built around these behavioral signals. Current product-analytics guidance describes the discipline as using event data to understand user experience, feature adoption, retention, and conversion, with AI increasingly becoming an interface for investigating those behavioral questions.
Suppose a SaaS company notices that onboarding completion has fallen from 68% to 57%. The number immediately tells the team that something changed. But the aggregate metric does not tell the whole story.
After segmentation, the team might discover that:
- returning users are largely unaffected;
- new users account for most of the decline;
- mobile users are affected more than desktop users;
- the largest drop occurs at the permissions step.
The original question was:
The better question is now:
Why are new mobile users disproportionately abandoning onboarding at the permissions step?
That is already a meaningful improvement in the investigation. AI can help accelerate this kind of analysis by finding unusual segments, comparing behavioral patterns, and surfacing relationships that might otherwise require several manual queries. But product usage data has a fundamental limitation.
It usually tells you what happened more reliably than it tells you why it happened. A drop-off is observable. Confusion is not necessarily observable.
Distrust is not necessarily observable. A customer’s expectation is not necessarily observable. That is where qualitative evidence becomes important.
Support Tickets Show Where the Product Creates Friction
Support tickets occupy a particularly valuable position because they often appear when the product fails to meet a user’s expectations. Customers contact support because something is:
- broken;
- confusing;
- unavailable;
- unexpectedly difficult;
- inconsistent;
- missing;
- producing an error;
- or preventing them from completing a goal.
That makes support conversations a potentially rich product signal.
Current AI support-analysis products are already being built around this idea. For example, Noisely describes using AI to extract bugs, feature requests, UX confusion, complaints, and other product signals from large volumes of support conversations.
The important word, however, is potentially. Support data has a selection bias.
Customers who have a smooth experience usually do not open a support ticket explaining that everything worked perfectly. Customers experiencing serious friction are much more likely to appear in the support dataset.
Atlassian explicitly identifies this limitation: support requests can be valuable for finding recurring issues and urgent pain points, but the resulting feedback may skew negative. So a product team should not conclude:
“Thirty percent of our customers hate this feature.”
because thirty percent of support tickets mention it. A more defensible conclusion would be:
“This issue appears repeatedly in support conversations and deserves investigation, particularly among the customer segments represented in those conversations.”
That distinction matters. Support tickets are not a census of customer opinion. They are evidence of customer friction.
User Feedback Explains the Experience Behind the Behavior
A support ticket can tell you that someone is stuck. A product event can tell you that many people are abandoning a workflow. A user interview can help explain what the experience feels like.
That distinction becomes especially important when the same behavioral pattern can have several possible causes. Imagine a product team sees a high abandonment rate at a permissions screen. The analytics answer is: Users are leaving.
Support tickets might add: Customers are asking why the product needs access. Interviews might add: The permission request appears unexpectedly, and users do not understand what they will get in exchange for granting access. Now the product team has a much stronger basis for investigation.
The problem may not simply be “bad onboarding.” It may be a combination of: unexpected request + insufficient explanation + lack of perceived value → uncertainty → abandonment. That is still an interpretation, not a proven causal chain.
But it is a much more useful hypothesis. This is why qualitative evidence matters. Productboard’s current guidance similarly distinguishes quantitative signals from qualitative feedback and behavioral feedback, arguing that the richest product understanding comes from combining what is happening with the context behind it.
No Single Product Signal Tells the Full Story
The practical difference between these sources can be summarized simply.
| Evidence source | What it primarily tells you | Strength | Limitation |
|---|---|---|---|
| Product usage data | What users actually do | Scale and measurable behavior | Often does not explain why |
| Support tickets | Where users encounter friction | Real-world problems and recurring issues | Can overrepresent frustrated users |
| User interviews | How users experience the product | Deep context and motivation | Smaller samples |
| Surveys | What users report at scale | Quantifiable attitudes and preferences | Responses can be shallow or biased |
| Reviews and communities | How users publicly perceive the product | External themes and recurring concerns | Context can be difficult to validate |
| Release and business context | What changed around the signal | Helps interpret timing and conditions | May exist outside product analytics |
The strategic lesson is not that one source should replace another. It is that different evidence sources answer different questions. The product team becomes stronger when those questions can be connected.
Why Combining Behavioral and Qualitative Evidence Is More Powerful
This is where AI product analysis becomes substantially more interesting. Consider two statements. Statement A:
“Feature adoption dropped.”
Statement B:
“Feature adoption dropped 18% among new mobile users after the redesigned workflow launched, while support conversations about the same workflow increased and users repeatedly described the new interface as confusing.”
Statement B is not automatically true as a causal explanation. But it is a much stronger investigative starting point. It contains:
- a measurable behavioral change;
- a specific segment;
- a time relationship;
- a product event;
- a qualitative pattern;
- and a potentially related support signal.
The difference is evidence integration. Dovetail’s April 2026 guidance makes essentially this same product-management point: the difficult skill is not analyzing qualitative or quantitative information independently, but connecting customer feedback with product metrics so that a measurable change can be traced to relevant user evidence. That connection is the focus of this article.
AI is not valuable simply because it can summarize 10,000 tickets. It becomes more valuable when it can help a team ask:
Which of these 10,000 conversations are relevant to the behavioral problem we are investigating?
And then:
Does the qualitative evidence support, contradict, or complicate what the behavioral data is showing?
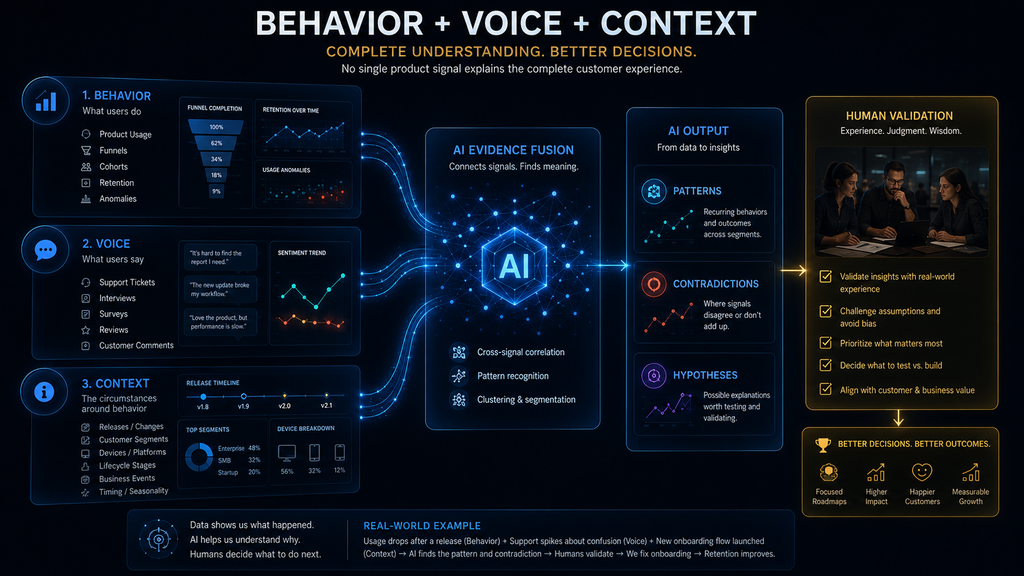
How AI Connects Product Usage Data, Support Tickets and User Feedback
The underlying process is more important than any individual AI feature. A useful AI-assisted workflow has several stages.
First, AI normalizes different descriptions of the same problem
Customers rarely use a consistent vocabulary. One person might say:
“I can’t download my report.”
Another might say:
“The export isn’t working.”
Another:
“Getting my data out of the system is a nightmare.”
A support agent may classify the issue as:
“Reporting — export.”
A product manager might call it:
“Data portability.”
These may be different descriptions of one underlying problem. AI can help recognize semantic similarity rather than relying only on exact keywords. That matters because keyword matching can fragment evidence.
A taxonomy or AI-assisted classification system can instead map related statements to common product areas and themes. Dovetail’s current guidance recommends a structured feedback taxonomy that maps feedback to product areas and themes, making it possible to compare qualitative themes with corresponding product metrics.
Second, AI clusters recurring problems
Once terminology is normalized, AI can help group related records. Instead of reading:
- 1,400 support conversations;
- 600 survey responses;
- 300 interview notes;
one by one, the product team can examine recurring clusters such as:
- Onboarding → Permissions → Confusing request
- Reporting → Export → Failed download
- Billing → Invoice → Incorrect tax calculation
- Search → Filtering → Missing results
The value is not the number of clusters. The value is that the team can see which themes recur across different sources.
A complaint appearing once in a survey may be interesting. The same underlying issue appearing in support tickets, interviews, reviews, and product behavior is more compelling.
Third, AI connects patterns to segments
A theme becomes much more useful when the team knows who experiences it. The same problem may affect:
- new users but not experienced users;
- mobile users but not desktop users;
- enterprise customers but not small businesses;
- users on one plan but not another;
- customers in one market;
- users acquired through one channel.
This is where qualitative and quantitative evidence can reinforce each other. Suppose AI identifies 900 feedback items mentioning a confusing onboarding step. That sounds important.
But segmentation might reveal that 820 of them come from a single customer segment that represents only 3% of the user base. That does not make the problem unimportant.
It changes the decision. The product team can now ask whether the affected segment has disproportionate revenue, strategic value, churn risk, or another reason to prioritize the issue.
Frequency is evidence. It is not automatically priority.
Fourth, AI can connect themes to behavioral changes
This is where the workflow starts becoming genuinely diagnostic. Imagine AI identifies a growing theme around “slow report export.” Product analytics show:
- report export usage has remained stable;
- export completion has declined;
- users who encounter the problem retry repeatedly;
- enterprise customers are affected disproportionately.
Support tickets show:
- more reports of exports timing out.
Now the qualitative and quantitative signals reinforce each other. The team has a much stronger basis for investigation than either source could provide alone.
Fifth, AI can surface contradictions
This is an underappreciated capability. AI should not only search for evidence that confirms an existing theory. It should also search for evidence that disagrees with it.
Suppose a product manager believes:
“Nobody uses this feature because customers don’t need it.”
But the data shows that the feature is heavily used by enterprise customers. Support tickets show that enterprise users depend on it. Interviews reveal that those users find the feature difficult but unavoidable.
The evidence contradicts the original interpretation. The problem is not lack of demand. It may be poor usability in a high-value workflow.
That is a completely different product decision. A useful AI analysis therefore asks two questions: What evidence supports this explanation? and
What evidence challenges it? The second question is essential if AI is going to support serious product decisions rather than merely confirm the user’s initial assumption.
From Product Signal to Product Diagnosis
At this point, it is useful to distinguish several levels of certainty.
| Stage | What the team can reasonably say |
|---|---|
| Signal | A measurable change occurred |
| Pattern | The change is concentrated or recurring |
| Relationship | Other relevant signals appear connected |
| Hypothesis | A plausible explanation fits the evidence |
| Validation | Investigation supports or rejects that explanation |
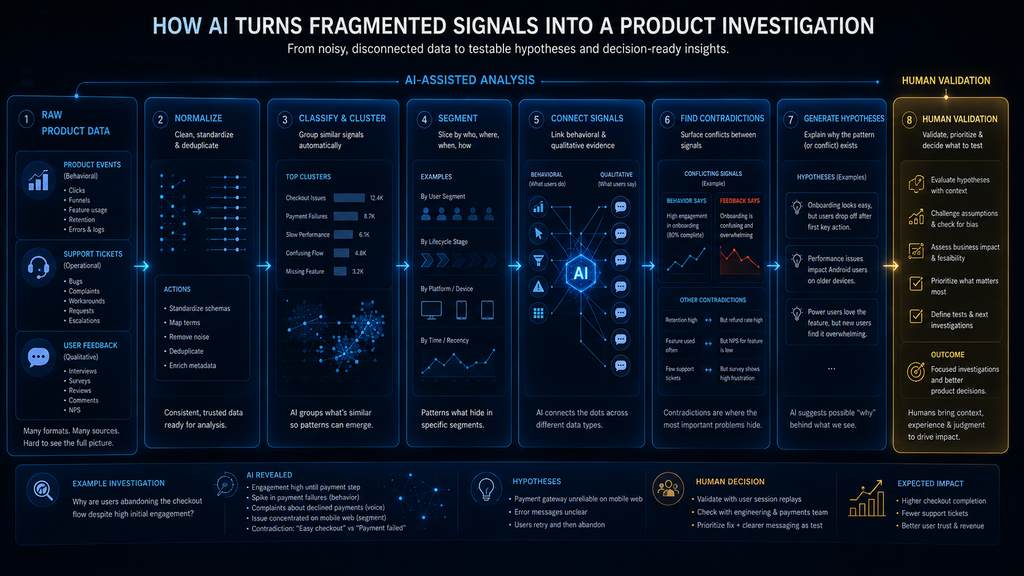
Consider this example.
- Signal: Checkout completion fell 11%.
- Pattern: The decline is concentrated among new mobile users.
- Relationship: Payment-verification errors increased during the same period.
- Hypothesis: The new verification experience may be creating friction that contributes to mobile abandonment.
- Validation: Technical investigation and controlled testing confirm whether changing the verification flow improves completion.
Those statements are progressively stronger. The problem with AI-generated product analysis is that a fluent model can make a hypothesis sound like a validated finding.
The language can be confident even when the evidence is not. That is why the product team should explicitly separate: what the data shows from what the AI infers from what the team has actually validated.
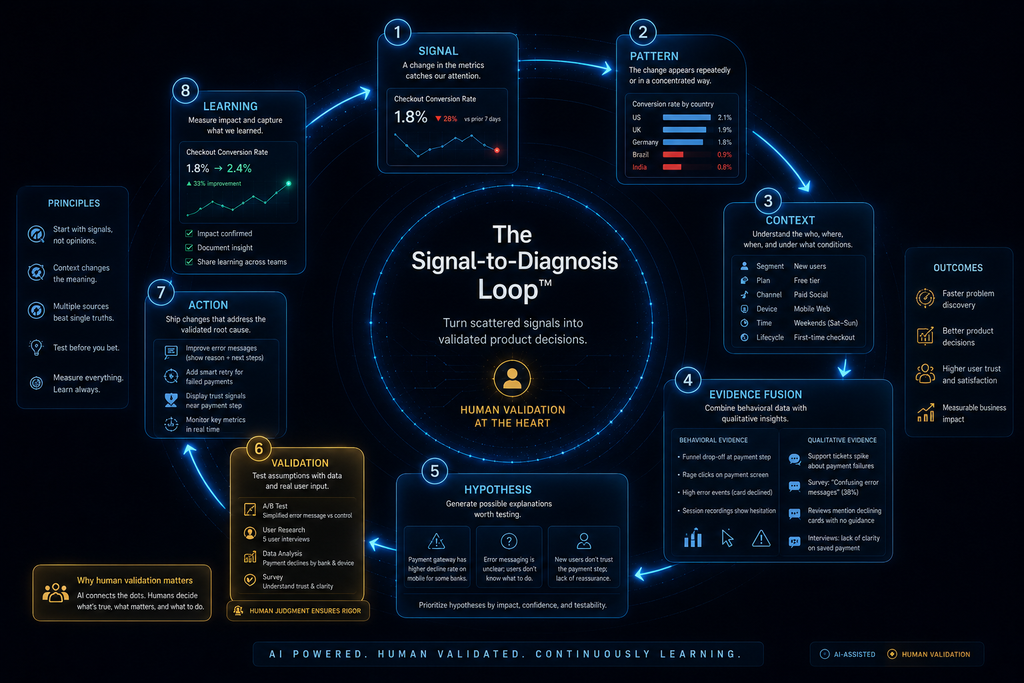
The Signal-to-Diagnosis Loop
A useful way to operationalize this process is: Signal → Pattern → Context → Evidence Fusion → Hypothesis → Validation → Action → Learning. The loop begins with something measurable. A metric changes.
A new complaint appears. A workflow breaks. An unusual behavior emerges.
AI helps determine whether the signal represents a broader pattern. Then the team adds context:
- who is affected;
- when it started;
- what changed;
- which workflow is involved;
- which segments are affected.
Next, behavioral and qualitative evidence are connected. AI can then generate possible explanations. But the process does not end there.
The explanation must be tested. If the evidence supports it, the team can act.
Then the original product signals are measured again. That final step matters because a product intervention should create a learning loop, not simply close an analysis ticket.
A Worked Example: Diagnosing an Activation Drop
Consider a fictional SaaS product that releases a redesigned onboarding experience. Within a week, the product team notices that activation has fallen by 9%.
The first signal
The analytics dashboard shows the decline. A basic report might say:
“Activation is down 9%.”
Useful, but incomplete.
The behavioral investigation
Further analysis shows that:
- the decline is concentrated among new users;
- mobile users are affected more strongly;
- the largest drop occurs at the permissions step;
- returning users show little change.
The investigation is now narrower:
Why are new mobile users abandoning onboarding at the permissions step?
The support evidence
AI analyzes recent support conversations and identifies an increase in questions related to:
- why permissions are required;
- whether access is safe;
- users being returned to the permissions screen;
- uncertainty about what to do next.
That strengthens the hypothesis that the step is creating friction.
The qualitative evidence
Recent user interviews contain comments describing the request as unexpected. Several users say they did not understand what they would receive in exchange for granting access. Now the product team has three aligned sources:
- Behavior: users abandon the step.
- Support: users report confusion around the step.
- Qualitative research: users do not understand the request or its value.
The hypothesis
A responsible AI-assisted conclusion would be:
The available evidence supports a hypothesis that the redesigned permissions step is creating confusion and abandonment among new mobile users.
It should not say:
“AI has identified the root cause.”
That claim would go beyond the evidence.
Validation
The team could then:
- review the implementation;
- examine session recordings;
- inspect technical logs;
- conduct targeted usability testing;
- simplify the explanation;
- run an experiment with an alternative flow.
Suppose the revised explanation and permission flow significantly improve completion. Now the team has stronger causal evidence.
The value of AI was not that it magically discovered the answer. The value was that it helped the team move from a broad metric change to a focused, evidence-backed investigation much faster.
Where AI Product Analysis Can Go Wrong
Connecting more data does not automatically produce better decisions. It can also create more ways to be confidently wrong.
Correlation can look like causation
Two signals can move together for unrelated reasons.
Support volume can distort importance
The most frequently reported issue is not always the most strategically important.
Sentiment can distort severity
An emotionally negative comment is not automatically a high-impact product problem.
AI can over-cluster
Different problems can be grouped together simply because their language looks similar.
AI can under-cluster
Users can describe the same underlying problem in radically different language.
Instrumentation can be wrong
AI cannot repair an event-tracking system that is collecting incorrect data.
Small but important problems can disappear
Rare issues may matter enormously to a valuable customer segment.
Existing assumptions can contaminate the analysis
If the product team asks AI to “prove why feature adoption is falling,” the model may search for supporting evidence instead of challenging the premise.
Privacy can become more complicated
Combining product usage with support conversations and customer records increases the amount of sensitive information being analyzed together. The solution is not to avoid AI. It is to build evidence discipline around AI.
AI Should Search for Disconfirming Evidence, Not Just Supporting Evidence
This deserves special attention because it changes how AI is used. Instead of asking:
“Why are users abandoning onboarding?”
ask:
“What evidence could explain the onboarding decline, and what evidence would contradict each explanation?”
Instead of:
“Why are customers unhappy with feature X?”
ask:
“Identify the strongest evidence for and against the hypothesis that feature X is causing dissatisfaction.”
This changes AI from a narrative generator into a hypothesis-testing assistant. The distinction is subtle but important.
A system that only summarizes what it sees can reinforce the first explanation. A system instructed to compare competing explanations can help the product team reason more rigorously.
When the Product Itself Uses AI, the Analysis Changes
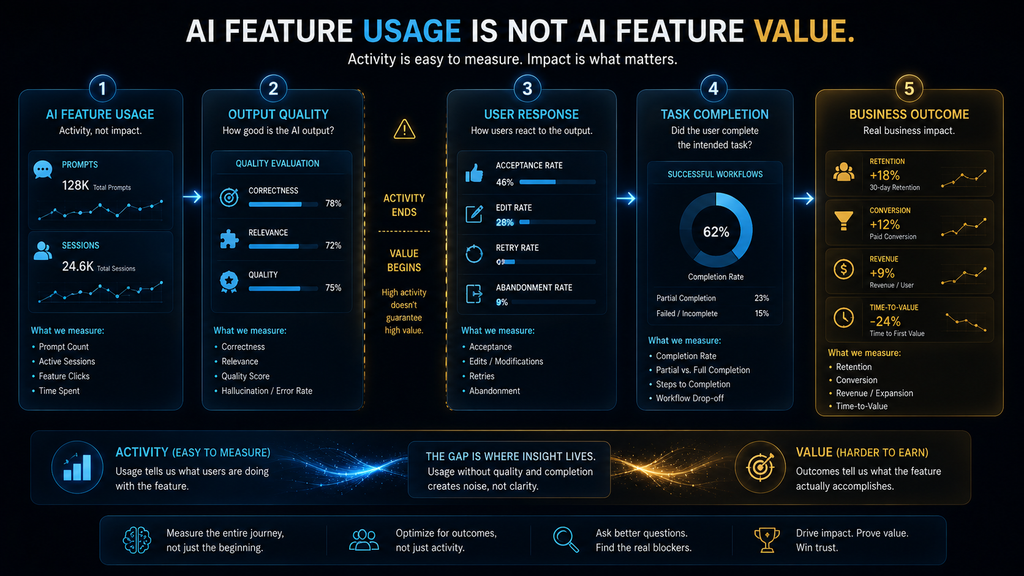
AI-powered products create another measurement challenge. Traditional product analytics might tell a team:
- how many people used a feature;
- how often they used it;
- how long they spent in it;
- whether they returned.
For an AI feature, those numbers can be misleading. Suppose an AI assistant receives 100,000 requests. That tells the team that users interacted with it.
It does not tell the team whether the assistant was useful. Users might be repeatedly regenerating answers. They might be correcting outputs manually.
They might abandon the workflow after a poor result. Or they might use the feature once and achieve their goal immediately. The raw request count cannot distinguish these outcomes.
Mixpanel’s 2026 research makes this point directly: traditional engagement metrics can show that an AI interaction occurred without showing whether the AI understood the user, produced something useful, or changed behavior in a lasting way. It recommends measuring AI products beyond simple activity metrics and connecting AI performance with business outcomes.
For AI products, the analytical chain becomes: User input → AI behavior → output → user response → downstream outcome. That means product teams may need to combine:
- prompt or task data;
- output quality;
- retries;
- edits;
- acceptance;
- task completion;
- latency;
- cost;
- safety or failure signals;
- retention;
- conversion;
- customer feedback.
The fundamental principle remains the same: Activity is not value. An AI feature can have high usage and poor outcomes. It can also have relatively low usage but enormous value in the workflows where it is used.
How to Build a Practical AI Product-Analysis Workflow
Product teams do not need to connect every data source on day one. Start with a real product question.
1. Define the question
Avoid:
“Analyze our product data.”
Instead:
“Why did activation fall among new mobile users after the latest onboarding release?”
A specific question gives the analysis boundaries.
2. Assemble relevant evidence
Bring together only the sources that can answer the question:
- relevant product events;
- funnel data;
- affected cohorts;
- support tickets;
- recent feedback;
- release history;
- technical incidents.
3. Normalize and classify
Use AI to organize unstructured information into consistent categories.
4. Segment
Compare the affected users against:
- unaffected users;
- different devices;
- plans;
- markets;
- lifecycle stages;
- customer types.
5. Identify patterns
Look for:
- unusual changes;
- recurring complaints;
- concentrated behavior;
- temporal relationships;
- contradictory evidence.
6. Connect the evidence
Ask whether the qualitative evidence relates to the behavioral signal.
7. Generate competing hypotheses
Do not ask AI for one answer. Ask for several plausible explanations and require evidence for and against each.
8. Validate the strongest explanations
Use the appropriate method:
- deeper analytics;
- technical investigation;
- interviews;
- usability testing;
- session review;
- controlled experiments.
9. Act
Choose the appropriate response:
- fix;
- redesign;
- educate;
- document;
- experiment;
- monitor;
- or deliberately do nothing.
10. Measure again
Return to the original signal. Did activation recover? Did support volume decline?
Did the affected segment improve? Did the intervention create another problem elsewhere? The loop is not complete until the product team learns what happened after the action.
How to Measure Whether AI Analysis Is Actually Helping
The wrong metric is: How many AI-generated insights did we produce? A system can generate hundreds of observations without improving one product decision. Better measures include:
| Metric | What it tells the product team |
|---|---|
| Time to detect | How quickly meaningful product changes are identified |
| Time to diagnose | How quickly teams move from a signal to a validated explanation |
| Evidence coverage | How many important conclusions can be traced back to source evidence |
| Hypothesis validation rate | How often AI-generated hypotheses survive investigation |
| False-positive rate | How much analytical noise the system creates |
| Repeat-issue rate | Whether recurring problems decline after interventions |
| Decision impact | Whether AI analysis materially changes or improves product decisions |
| Outcome improvement | Whether the resulting intervention improves the original product metric |
The most important metric may be time to diagnose. If a team can detect a problem in five minutes but still takes three weeks to understand it, the main bottleneck has not been removed. The real value of AI appears when it shortens the path between: “Something changed.” and “Here are the strongest explanations, the evidence behind them, and the next validation step.”
What Happens When Product Signals Stay Fragmented?
Fragmentation has a hidden cost. Support may repeatedly answer the same customer question without the product team realizing how common it is. Product analytics may show a recurring drop-off without the PM knowing that customers have been describing the same problem in support conversations for months.
Research may identify a usability issue that never gets compared against actual behavioral data. Sales may know that a major customer segment is struggling while the product dashboard shows only an average across the entire user base. The organization can therefore possess plenty of intelligence while still lacking a shared evidence picture.
AI does not automatically solve this organizational problem. But it can make the cost of connecting the evidence much lower. That creates a potentially important shift in product management.
The scarce resource may move away from simply finding signals and toward deciding which validated signals deserve action. That is where product analysis connects naturally to roadmap prioritization.
From Product Diagnosis to Product Decisions
A product team should not confuse diagnosis with prioritization. Suppose AI-assisted analysis identifies three validated problems:
- A minor onboarding usability issue affecting 35% of new users.
- A serious reporting bug affecting 2% of enterprise accounts.
- A frequently requested feature affecting 15% of customers.
The analysis tells the team what is happening and provides evidence about the problems. It does not, by itself, determine which one deserves roadmap capacity. That decision also depends on:
- customer value;
- revenue impact;
- strategic alignment;
- implementation cost;
- risk;
- urgency;
- competitive pressure;
- opportunity size.
This distinction keeps this article separate from our AI roadmap prioritization guide.
- This article is about evidence and diagnosis
- Roadmap prioritization is about choosing among competing opportunities
The first strengthens the second. It does not replace it.
The Future: From Analytics Dashboards to Continuous Product Diagnosis
Product analytics is gradually moving beyond static dashboards.
Current platforms are increasingly adding natural-language interfaces, AI-assisted investigation, anomaly detection, and automated analysis. Mixpanel describes AI becoming a default interface for asking questions about product behavior, while Atlassian and Productboard are building AI-assisted systems for organizing and synthesizing customer feedback.
The direction is important. A traditional dashboard might tell a PM:
Activation declined 9%.
An AI-assisted product-analysis system could potentially go further:
Activation declined 9% among new mobile users beginning shortly after the onboarding release. The largest behavioral change occurs at the permissions step. Support conversations about permissions increased during the same period, with recurring complaints about unclear requirements. This supports several possible explanations; technical verification and targeted user research are recommended before treating any one explanation as causal.
That is a different type of interface. The dashboard remains the evidence surface.
AI becomes the investigation layer. The human product team remains accountable for deciding what the evidence means and what should happen next.
The More AI Analyzes, the More Important Evidence Quality Becomes
There is a counterintuitive consequence to all of this. If AI makes analysis dramatically cheaper, product teams will be able to investigate far more questions. That sounds entirely positive.
But cheaper analysis can also create more noise. More correlations. More alerts.
More themes. More hypotheses. More possible explanations.
The bottleneck can therefore move. Instead of asking:
“What can we learn from our data?”
teams may increasingly need to ask:
“Which of these findings are strong enough to influence a product decision?”
That makes evidence quality, traceability, validation, and judgment more valuable—not less. AI may reduce the cost of generating hypotheses. It does not reduce the cost of being wrong.
Final Thoughts
Product teams do not need another source of disconnected information. They need a better way to connect the information they already have. Product usage data can show that behavior changed.
Support tickets can reveal where customers encounter friction. User feedback can explain how that experience is perceived. Business and release context can show what else changed around the same time.
AI can help bring those signals together, identify patterns, compare segments, surface contradictions, and generate hypotheses for investigation. That is where its value becomes much more meaningful than simple summarization. But the most important discipline is knowing where AI’s role ends.
A metric is not an explanation. A correlation is not causation. A recurring complaint is not automatically a roadmap priority.
And an AI-generated hypothesis is not a validated root cause. The strongest workflow is therefore: Signal → Pattern → Context → Evidence Fusion → Hypothesis → Validation → Action → Learning. AI can accelerate much of that journey.
Human judgment still determines what the evidence means, which trade-offs matter, what gets changed, and whether the intervention actually worked. As AI makes product analysis faster, that judgment becomes more valuable—not less.
The advantage is not having more product data. It is being able to connect the right signals, test the right explanations, and make decisions with evidence strong enough to act on.
Use Product Evidence to Discover What to Build Next
AI can help product teams understand what is happening inside the product by connecting behavioral signals with support conversations and user feedback.
Explore AI Product Discovery →FAQ
What is AI product data analysis?
AI product data analysis uses artificial intelligence to examine product usage data, customer feedback, support conversations, and related context to identify patterns, relationships, anomalies, and hypotheses that can help product teams investigate problems and improve decisions.
How does AI analyze product usage data?
AI can help product teams examine behavioral patterns across events, funnels, cohorts, feature adoption, retention, and other product signals. Modern analytics platforms are increasingly adding AI interfaces and investigation capabilities to these workflows.
Can AI analyze support tickets?
Yes. AI can classify, cluster, summarize, and extract recurring product signals from large volumes of support conversations. Current tools already use AI to identify bugs, feature requests, confusion, complaints, and other themes in support data.
Why combine product analytics with user feedback?
Product analytics primarily shows behavioral patterns, while qualitative feedback provides context about how users experience those behaviors. Combining them can help teams investigate not only what changed but also which explanations are worth testing.
Can AI identify the root cause of a product problem?
AI can generate and compare plausible root-cause hypotheses, but an AI-generated explanation should not automatically be treated as a validated root cause. Correlation and temporal proximity are evidence for investigation, not proof of causation.
Is support-ticket volume a good way to prioritize product problems?
Not by itself. Ticket volume indicates frequency within the support population, but it can overrepresent frustrated users and may not reflect strategic importance, revenue impact, or severity.
Is sentiment analysis enough to understand customer problems?
No. Sentiment can provide useful context, but it does not automatically indicate business impact, frequency, severity, or causation. It should be combined with behavioral and contextual evidence.
How should product teams validate AI-generated hypotheses?
The appropriate method depends on the problem. Teams may use deeper analytics, technical investigation, user interviews, usability testing, session review, experiments, or controlled releases to test whether an AI-generated hypothesis is supported.
How is AI product analytics different for AI-powered products?
AI-powered products require teams to measure more than feature usage. They may also need to examine output quality, retries, task completion, downstream outcomes, latency, cost, and whether AI interactions actually improve customer or business results.
What is the biggest advantage of AI in product analysis?
Its strongest advantage is not simply summarizing more information. It is helping teams connect large amounts of behavioral and qualitative evidence quickly enough to investigate problems that would otherwise require substantial manual effort.
Related Guides
- How AI Analyzes Customer Feedback, Calls & Interviews at Scale
- How AI Finds Themes, Patterns & Sentiment Across Conversations
- How AI Interview Analysis Works: Transcripts, Themes & Insights
Written by
Muntasir Ahmad Chowdhury
Founder, AI Hustle World
Muntasir Ahmad Chowdhury is the Founder of AI Hustle World, an independent publication dedicated to making Artificial Intelligence practical, trustworthy, and easy to understand. He researches AI tools, automation, customer service, productivity, and real-world business applications, helping readers make smarter technology decisions through research-driven, experience-backed content.
Expertise:
AI Tools • AI Automation • AI Customer Service • AI Productivity • Generative AI • AI Workflows
Get Smarter With AI
Enjoyed this guide? Get practical AI tools, tutorials, and honest reviews delivered to your inbox.