How to Repurpose Research into LinkedIn Posts, X Threads & Newsletters
Research is some of the most valuable source material a content team can own because a single report may contain a headline finding, several secondary patterns, useful comparisons, methodological lessons, limitations, contradictory signals, and practical implications. One substantial research project can therefore support weeks of distribution across LinkedIn, X, newsletters, and other channels without requiring the team to invent new topics every day.
Research is also unusually easy to damage during repurposing. A finding can change meaning when the population disappears, an association is rewritten as causation, a vendor survey loses its attribution, a forecast becomes a factual statement about the future, or a qualitative theme is presented as though it represents an entire market. AI can accelerate all of those transformations, which makes the editorial controls around the model more important rather than less important.
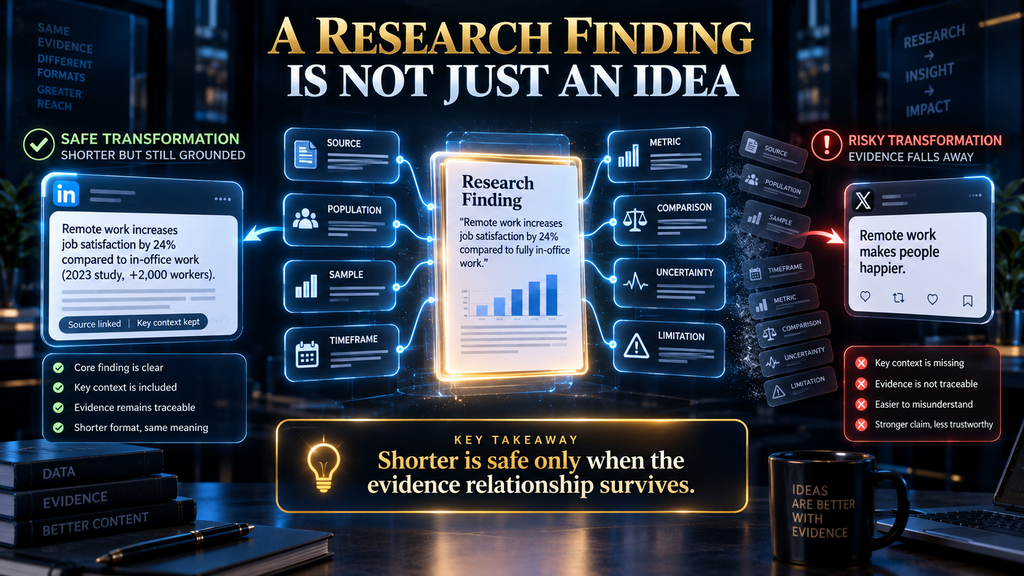
That is the key difference between repurposing research and repurposing an ordinary article. The reusable object is not simply an idea; it is a finding attached to evidence, and the relationship between those two has to survive when the format changes.
The strongest research-repurposing workflow therefore does not begin by asking AI for a LinkedIn post, an X thread, and a newsletter. It begins by identifying exactly what the source establishes, what context keeps that finding honest, and which parts of the explanation can safely change without strengthening the evidence beyond what the original research supports.
The editorial rule for this entire process is simple: repurpose the finding, but preserve the evidence relationship.
Why Research Requires a Different Repurposing System
Ordinary educational content can often tolerate aggressive compression because the core idea remains reasonably stable when examples or secondary explanation are removed. If an article argues that content teams should choose distribution channels according to audience fit, that principle can usually survive in a shorter social post without changing what the original author meant.
Research findings depend more heavily on the conditions around them. A result may apply only to a specific group, geography, date range, test condition, measurement method, sample, or comparison, which means removing the wrong detail can materially strengthen or broaden the claim.
Imagine that a survey reports that 62% of 1,200 ecommerce operators across three markets experienced catalog-data problems during product-recommendation workflows. A careless social rewrite might become, “Most ecommerce businesses have product-data problems,” which sounds similar while silently expanding a defined survey result into a claim about an entire industry.
The number did not change, but the evidence relationship did.
This is why “simplify the research” is not a sufficient editorial instruction. The better objective is to make the finding as understandable as possible without changing what the evidence permits the publication to say.
Guidance from the US National Institute on Aging makes a similar distinction when advising researchers to communicate with non-scientists: understand the audience, select a small number of take-home messages, provide necessary context, explain why the research matters, and replace unnecessary jargon with accessible language. The point is not to preserve every technical detail; it is to remove complexity intelligently while retaining the information the audience needs to interpret the result correctly.
The Biggest Risk Is Not Shorter Writing — It Is Stronger Claims
Research rarely moves directly from a paper or report to the audience. A finding may become an executive summary, a press release, an article, a social post, a newsletter, a sales slide, and then another social post generated from that secondary material.
Every transformation creates an opportunity for the claim to become slightly more confident.
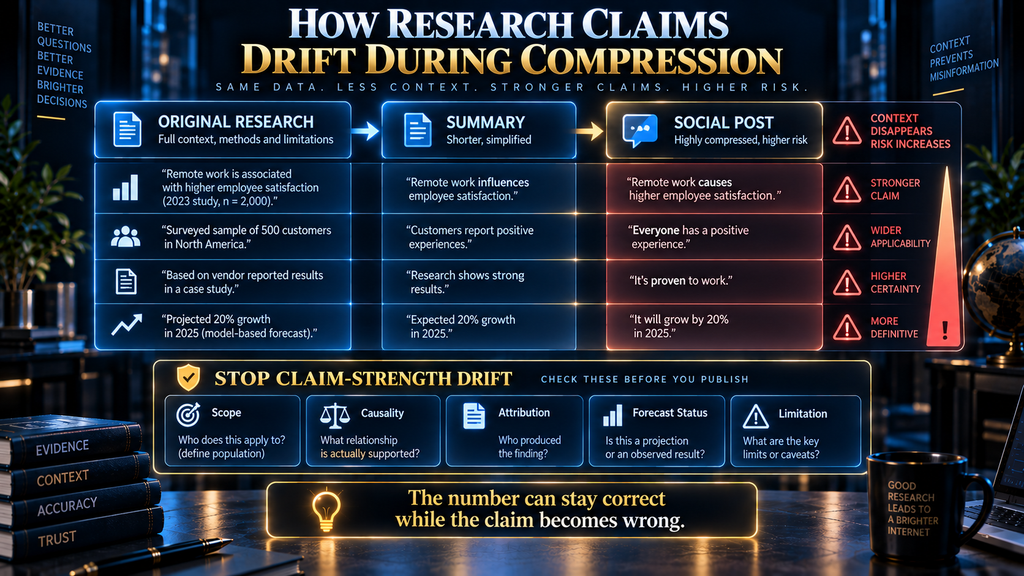
A study might report that two variables were associated. The first summary may describe one variable as influencing the other, and the eventual social post may say that it causes the outcome. The words become cleaner and more decisive while the evidence becomes less faithfully represented.
This type of drift has been documented in research communication. A BMJ study examining 462 university press releases, their associated biomedical research papers, and 668 related news stories found substantial rates of exaggerated advice, causal claims, and inference beyond what the original papers supported; exaggerated press releases were also strongly associated with similar exaggeration in subsequent news coverage.
That study concerned biomedical science rather than B2B LinkedIn content, so it should not be treated as a direct benchmark for marketing workflows in 2026. The useful lesson is narrower and highly relevant: when evidence is repeatedly translated into simpler communication, claim strength can change before anyone notices that the meaning changed with it.
AI increases the speed at which that drift can happen. If one inaccurate summary becomes the source for five posts, three threads, and two newsletters, the workflow has not merely created one error; it has created an error-distribution system.
A safer process keeps every important derivative connected to the original evidence record rather than allowing each derivative to inherit truth from the previous piece of content.
Separate Evidence Extraction From Content Generation
The first AI task should therefore not be creative writing. It should be evidence extraction.
Instead of asking a model to “turn this report into ten posts,” ask it to identify the research claims, source type, population, sample, timeframe, metric, comparison, study design, uncertainty, limitations, and any contextual information that materially affects interpretation. The objective is to create a structured representation of what the research actually says before persuasive language enters the workflow.
This separation matters because extraction and communication require different types of judgment. During extraction, the question is whether the model represented the source accurately; during drafting, the question is how to make an approved finding useful and understandable for a particular audience.
When both tasks happen inside one large prompt, mistakes become harder to trace. If the final LinkedIn post overstates a finding, the editor cannot easily tell whether the model misunderstood the source, selected the wrong evidence, removed an important qualifier, or simply used an overly confident phrase during drafting.
A reviewable evidence ledger creates a control point between those stages.
| Evidence Field | What Should Be Recorded |
|---|---|
| Claim | The finding the source actually supports |
| Source | Original paper, report, dataset, survey, benchmark, case study, or other source |
| Source Type | Independent research, vendor research, government data, internal analysis, case study, forecast, review, etc. |
| Population | Who or what the result applies to |
| Sample | Number of observations, respondents, cases, tasks, or other relevant units |
| Timeframe | When data were collected or what period the result covers |
| Metric | What was measured and in what unit |
| Comparison | Baseline, group, condition, prior period, alternative, or control |
| Claim Strength | Descriptive, comparative, associative, causal, predictive, or qualitative |
| Uncertainty | Confidence interval, range, methodological uncertainty, model uncertainty, or other material limitation |
| Limitation | Where the finding should not be generalized |
| Freshness | Whether the evidence remains suitable for the current decision |
This ledger does not need to appear publicly in every social post. Its purpose is internal: it establishes the evidence boundary that subsequent writing is allowed to transform but not silently expand.
AI can build the first version quickly, especially when the source is long. A human should still verify high-impact findings against the original source because the model can misunderstand methodology, miss limitations buried outside the executive summary, or infer a mechanism the researchers never tested.
The AI Hustle World Research-to-Channel Evidence Preservation Map
The AI Hustle World Research-to-Channel Evidence Preservation Map is an editorial decision framework for deciding what information must remain attached to different types of research claims when they are transformed into LinkedIn posts, X threads, and newsletters.
The framework does not rank channels by engagement, reach, or performance. Its purpose is narrower: determine the Minimum Evidence Payload needed to keep a research claim materially faithful and then identify which channel can carry that payload without excessive distortion.
Methodology: The AI Hustle World Research-to-Channel Evidence Preservation Map is an editorial decision framework for determining what contextual evidence should remain attached to different kinds of research claims when they are adapted for LinkedIn posts, X threads and newsletters. It classifies common claim types, identifies their Minimum Evidence Payload, highlights the main distortion risk created by compression, and assesses how naturally each destination can carry the required context. The framework is an editorial synthesis rather than a statistically validated channel-performance model.
| Research Claim Type | Minimum Evidence Payload | Main Distortion Risk | X Thread | Newsletter | |
|---|---|---|---|---|---|
| Descriptive statistic | Source, population, timeframe, metric or unit | Number detached from who, when, or what | Strong fit | Strong if context remains | Strong fit |
| Survey finding | Source, sample/population, field dates, relevant question context | Sample presented as the whole population | Strong | Strong | Excellent |
| Comparison | Groups/options, metric, timeframe, relevant baseline | “Higher” or “better” without compared-with-what context | Strong | Strong | Excellent |
| Correlation / association | Variables, population, direction, magnitude where useful, non-causal wording | Association rewritten as causation | Strong | Conditional | Excellent |
| Causal estimate | Study design, treatment/comparison, population, effect, uncertainty | Certainty generalized beyond the design | Conditional | Conditional | Strong |
| Trend / time series | Metric, start/end period, population/geography, relevant baseline | Short movement presented as durable trend | Strong | Strong | Excellent |
| Experiment / benchmark | Task, sample, conditions, metric, comparator | Result generalized beyond test conditions | Strong | Conditional | Excellent |
| Qualitative finding | Participants/source, method, context, theme | Theme presented as population prevalence | Strong | Conditional | Excellent |
| Vendor/customer case study | Vendor attribution, customer, scenario, reported outcome | Commercial evidence presented as independent proof | Strong with attribution | Conditional | Strong |
| Forecast / model estimate | Source/model, horizon, assumptions where material, uncertainty | Prediction presented as known future fact | Conditional | Conditional | Excellent |
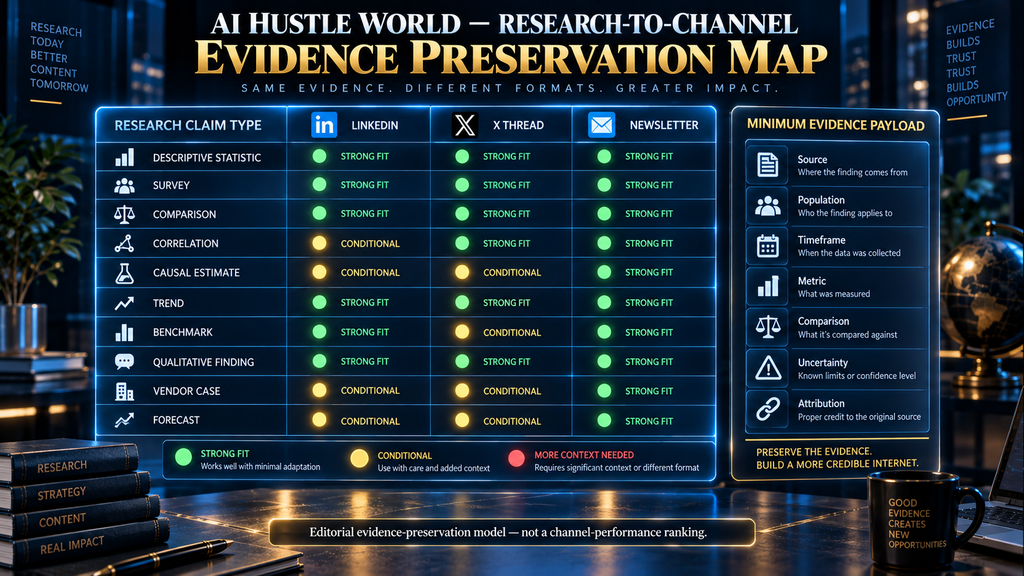
The most important part of the framework is the phrase Minimum Evidence Payload. It means the smallest set of contextual information that needs to travel with a research claim so that shortening the explanation does not materially change what a reasonable reader would conclude.
A descriptive statistic might require little more than the population, timeframe, metric, and source. A causal estimate may require study design, comparison condition, effect size, studied population, and relevant uncertainty, while a benchmark can require the exact task, model version, comparator, evaluation metric, and test conditions.
The framework therefore treats channel selection as a downstream decision. Instead of asking, “How can we turn this result into an X post?” the editor first asks, “What information must remain attached to this result?” and then chooses the destination that can carry it naturally.
That reversal is what makes research repurposing safer.
Different Findings Have Different Compression Limits
Research teams often speak about “the data” as though every result can be summarized using the same editorial rules. In practice, different claim types tolerate very different amounts of compression.
A simple descriptive statistic can sometimes be communicated in one sentence because the claim does not imply a mechanism. A causal estimate may require substantially more explanation because the reader needs enough information to understand what was compared, under which design, and how certain the result is.
The same distinction appears in plain-language research communication. Cochrane’s current reporting guidance says plain-language summaries should stand alone, communicate key findings clearly to non-experts, and remain consistent with the conclusions of the full review. That principle is useful far beyond systematic reviews because it captures the goal of research repurposing: the derivative can be simpler than the source without becoming a different conclusion.
Descriptive Statistics: Preserve the Population
Descriptive statistics often look easiest to repurpose because they usually contain an attractive number. The hidden risk is that the audience or population gets broadened while the percentage remains unchanged.
Suppose the research states that 42% of 900 surveyed US retailers reported increasing their use of AI-assisted merchandising during the previous year. A weak derivative might say, “42% of retailers are increasing AI use,” which quietly removes the survey framing, location, and potentially the exact activity being measured.
The stronger version does not need to reproduce the entire methodology, but it should preserve enough context for the reader to understand what the 42% describes. That may require only a few extra words, yet those words determine whether the statistic is accurate.
This is why numeric accuracy alone is not sufficient during fact checking. A social post can reproduce the exact number from the report and still misrepresent the research if the nouns around the number change.
Survey Findings: Keep the Sample Inside the Claim
Survey findings deserve additional caution because percentages naturally sound representative. A survey of 800 enterprise technology leaders who already use generative AI is not evidence that 800 randomly selected businesses, much less “all companies,” hold the same view.
The editor should preserve who was surveyed, when the fieldwork occurred, and enough question context to understand what respondents were actually reporting. If the survey was conducted by a vendor with a commercial interest in the subject, that source identity may also be relevant to interpretation.
AI frequently removes those qualifiers because they make the opening less compact. In research content, however, a cleaner sentence is not automatically a better sentence when the omitted words define the scope of the evidence.
The correct compression keeps the claim narrow enough to match the study rather than broadening the study until it matches the desired headline.
Correlation: Protect the Difference Between “Associated With” and “Caused”
Associational research creates one of the most dangerous repurposing problems because causal language sounds more decisive.
A study might find that companies with greater use of automated follow-up also report higher customer retention. An AI-generated post may rewrite that as, “Automated follow-up increases customer retention,” because the second sentence appears clearer and more actionable.
Those statements are not equivalent. The first reports a relationship; the second says that changing one factor produces an effect in the other.
The evidence ledger should therefore record whether a finding is descriptive, associative, causal, or predictive before drafting begins. If the source uses language such as “associated with,” “correlated with,” or “linked to” because the design does not establish causality, the derivative should not upgrade the conclusion to “causes,” “drives,” “leads to,” or “results in” without stronger evidence.
A final evidence-loss check should explicitly ask whether the new format increased the implied causal strength of the claim. Ordinary grammar review will not reliably catch this problem because the stronger sentence may sound perfectly natural.
Causal Findings: Strong Evidence Still Has Boundaries
Even when the research design genuinely supports causal inference, the result still applies under particular conditions.
An experiment may show that an intervention caused an outcome in one population, under one treatment protocol, across one duration, using one measurement method. That does not automatically mean the same intervention will produce an identical result for every population or implementation.
This matters during repurposing because strong evidence can tempt the writer to remove every qualification. The original study may support causal language while still requiring boundaries around magnitude, population, environment, or uncertainty.
The Minimum Evidence Payload should therefore preserve the conditions that materially affect generalization. A LinkedIn post may have enough room for those limits, while a complicated result might be better handled in a newsletter that can explain the design and implications without forcing every detail into the hook.
The goal is not cautious writing for its own sake. It is proportionate language: the confidence of the communication should match the strength and scope of the underlying evidence.
Comparisons: Never Lose the Baseline
Words such as “better,” “higher,” “faster,” and “more effective” require a reference point.
If a benchmark reports that Model A scored 18% higher on a particular task, the reader needs to know what Model A was compared with and what metric produced that difference. Removing the baseline creates a claim that sounds quantitative while becoming less informative.
The same issue appears in business research. A report may say that companies with mature data-governance programs experienced fewer deployment delays than companies without formal governance, but a derivative can easily become “data governance reduces deployment delays” without preserving how the groups were defined or whether the study established causation.
Comparison posts therefore need enough space to preserve the decision criteria. If several trade-offs matter, an X thread, LinkedIn document, or newsletter may be more suitable than one short headline.
A useful compression strategy is to narrow the comparison rather than pretending to summarize every dimension. The writer can say that one option performed better on a specific metric under a specific condition, leaving broader evaluation for the full research.
Trends: Preserve the Timeframe
A one-month increase, a year-over-year change, and a five-year structural shift can all be described as “growth,” but they support very different interpretations. If the timeframe disappears, a temporary movement can be presented as though it reflects a durable market transformation.
Trend-based derivatives should preserve the metric, relevant population or geography, and period being compared. The baseline often matters just as much as the latest number because percentages can look dramatic when they begin from a very small base.
X threads can work well for trends because the first post can introduce the change while later posts explain the baseline, timeframe, potential explanations, and limitations. LinkedIn can carry the same material when the value lies in professional interpretation rather than rapid commentary.
Newsletters are particularly useful when the trend has competing explanations or when several historical periods need to be compared before the business implication becomes clear.
Benchmarks: Preserve the Test Conditions
Benchmarks look authoritative because they produce scores, rankings, and controlled comparisons. Their meaning still depends heavily on how the test was designed.
An AI model that performs better on one benchmark does not automatically become “the best AI model.” The tested task, model version, prompting conditions, evaluation criteria, sample, comparator, and scoring method can all affect what the result actually tells us.
Research-heavy technology content needs to preserve those conditions because benchmark results are particularly easy to turn into universal winners during social compression. A phrase such as “Model A outperformed Model B on benchmark C under these test conditions” may be accurate while “Model A is better than Model B” is not.
The social format should therefore follow the complexity of the benchmark. One clear result can fit LinkedIn; a multi-condition comparison may deserve a thread or newsletter where the audience can see why one model wins on one task and loses on another.
Qualitative Findings: Do Not Manufacture Quantification
Qualitative research often reveals themes, motivations, experiences, explanations, and recurring concerns that quantitative surveys cannot capture easily. Those findings can produce excellent LinkedIn posts and newsletters because they help readers understand why a behavior or problem occurs.
The distortion happens when a theme is rewritten as a population statistic.
If 14 interview participants repeatedly describe implementation anxiety, the research may support the statement that implementation anxiety was a recurring theme in those interviews. It does not automatically support the claim that “most companies are anxious about implementation.”
The difference matters because qualitative methods usually explore meaning rather than estimate population prevalence. AI may erase that distinction when it tries to make the result more concise or authoritative.
The safest wording preserves the method. Phrases such as “a recurring theme among interviewees” or “participants frequently described” can communicate the insight clearly without pretending the research measured a percentage it never measured.
Vendor Research: Keep the Provenance Visible
Industry content frequently relies on research produced by software vendors, consulting firms, platforms, and companies with a commercial interest in the topic.
That does not make the evidence unusable. Some vendor reports contain large datasets, useful methodology, and valuable market insight.
The important editorial question is whether the audience should know who produced the research to interpret it fairly. If a company selling customer-service automation publishes a survey showing that businesses want more automation, the source does not need to be dismissed, but the derivative should not quietly transform the result into an unattributed statement that “research proves companies want more automation.”
A stronger sentence might say, “In Vendor X’s survey of 1,500 support leaders…” and then present the finding accurately. The attribution gives readers information they need to evaluate provenance without forcing the writer to editorialize about the vendor’s motives.
Customer case studies deserve the same treatment. A vendor-reported result from one customer can demonstrate that an outcome occurred in that implementation, but it should not be repurposed as an independent estimate of what every user should expect.
Forecasts: Keep the Future in the Future
Forecasts are especially attractive for social media because large future numbers make powerful headlines. The problem begins when predictive language disappears.
A market report may estimate that a sector could, may, or is projected to reach a particular size by 2030. A derivative that says the sector will reach that number transforms a modeled future into a factual statement about something that has not happened.
The Minimum Evidence Payload for forecasts should therefore preserve the source, forecast horizon, predictive status, and important assumptions or ranges when they materially change the interpretation. The closer the post comes to investment, financial, policy, or strategic decision-making, the more important those boundaries become.
Newsletters are often the strongest destination for forecasts because they provide room to explain the assumptions behind the projection. LinkedIn can still work when one forecast is clearly attributed and paired with a useful implication, while a single short post may be unsuitable when the uncertainty cannot fit without becoming misleading.
Research Uncertainty Is Part of the Finding
Content systems often reward certainty because confident claims create cleaner hooks. Research does not always cooperate with that incentive.
Uncertainty can come from sampling, measurement, model assumptions, incomplete information, conflicting findings, wide confidence intervals, or legitimate disagreement about interpretation. Removing uncertainty may make the post more decisive, but it can also change the evidence.
There is a real distribution trade-off here. A 2024 study analyzed more than two million social-media messages about scientific findings and found that messages expressing greater uncertainty were shared less often; a controlled experiment in the same research also found lower sharing intentions for higher-uncertainty messages.
That result should not be turned into a universal social-media rule, and it certainly does not justify removing uncertainty. It demonstrates a tension that research communicators need to manage: the version that spreads most easily may not be the version that communicates the evidence most faithfully.
The editorial solution is better uncertainty communication rather than pretending uncertainty does not exist. CDC guidance explicitly recommends acknowledging what is known and unknown instead of over-reassuring audiences, because uncertainty is part of how evidence changes over time.
This does not mean every LinkedIn post needs a paragraph of statistical hedging. It means uncertainty should remain visible when removing it would materially increase the apparent strength of the finding.
Translate the Language, Not the Evidence Strength
Research can be difficult to read because technical vocabulary and complex sentence structures accumulate around the findings. AI is particularly useful here because it can explain jargon, shorten sentences, reorganize material, and create examples for a less technical audience.
Those transformations should be aggressive when they improve comprehension without altering the claim.
A term such as “statistically significant association” may need explanation for a general business audience. The solution is not to rewrite the result as “X definitely works,” because that has changed the evidence rather than translated the language.
A useful editorial distinction is to separate presentation variables from evidence variables. Presentation variables include jargon, order, hook, examples, sentence structure, pacing, visual format, and narrative style; evidence variables include population, attribution, claim type, relevant comparison, material uncertainty, and limitations that determine interpretation.
AI can transform the first category freely within the brief. The second category should be treated as controlled information.
This approach allows the output to sound natural rather than academic while still protecting the research underneath it.
Research Should Be Atomized by Finding, Not by Report Section
A fifty-page report is not fifty potential posts, and a “Key Findings” section does not automatically contain one publishable social asset per bullet. The most useful repurposing unit is an evidence atom: one finding together with the context required to understand what that finding actually means.
An evidence atom may be a descriptive statistic, association, comparison, trend, benchmark result, qualitative theme, case outcome, forecast, contradiction, methodological insight, or limitation. Two paragraphs from the same report may therefore carry completely different evidence requirements.
Before selecting a channel, the editor should decide whether the atom has a meaningful reason to exist outside the report. Does it change a decision, challenge a common assumption, explain a mechanism, provide new context, reveal a trade-off, or raise an important question?
If the answer is no, AI should not be asked to manufacture an angle merely because the content calendar has an empty slot. Research repurposing works best when the team distributes valuable findings, not when it extracts every possible sentence from an expensive report simply to increase output count.
LinkedIn Should Interpret One Finding, Not Recreate the Executive Summary
LinkedIn is well suited to research-derived content because standard posts currently allow up to 3,000 characters, giving the writer enough room to establish context and develop an interpretation rather than relying on a headline alone. That space should not be used to compress the entire report into one miniature abstract.
A stronger research-derived LinkedIn post usually begins with one decision-relevant finding and then develops why that result matters. The post can identify the population or source, explain the practical implication, acknowledge a material limitation when necessary, and add an interpretation that helps the reader connect the research to a real decision.
Imagine a report showing that companies with formal AI-evaluation processes report fewer deployment failures. A weak post might say that research proves governance reduces AI failures, while a more disciplined version would explain who was studied, describe the observed relationship accurately, clarify whether the research was observational, and then ask what governance practices could plausibly explain the difference.
That version does more than preserve accuracy. It creates original editorial value because the social post contributes interpretation rather than simply repeating the report.
The source supplies the finding; the LinkedIn post earns its reason to exist by explaining what a practitioner should notice about that finding.
LinkedIn Is Also a Strong Home for Limitations
One underused strategy is to repurpose the limitation instead of the headline result.
Research limitations often reveal where common advice stops working, which can be more interesting to an experienced professional audience than another post repeating the headline statistic. If a productivity study reports large gains from AI assistance but tests only experienced users performing narrow tasks in a controlled environment, the limitation raises an important operational question about whether those gains survive onboarding, review, exceptions, coordination, and maintenance.
That question can support a complete LinkedIn post without misrepresenting the research. The article or report may still contain the full finding and methodology, while the social derivative uses the limitation to help readers make a more sophisticated decision. This is a good example of research repurposing creating something genuinely new without inventing new evidence.
X Threads Should Use Sequence to Preserve the Evidence
X defines a thread as a series of connected posts that can provide additional context or extend a point. Standard posts remain limited to 280 characters, while longer posts are available through Premium features, which makes the thread useful when a research finding cannot be communicated honestly in one short unit.
The strongest research threads are designed as evidence sequences, not paragraphs that have been chopped wherever the character counter runs out.
A thread might begin with the most important finding and then use subsequent posts to establish who was studied, how the result was measured, what it suggests, what it does not establish, and what a practitioner should do with that information. The exact number of posts should depend on the finding rather than on a rigid template.
This structure gives the format a genuine advantage. Research that would be misleading in one isolated post can remain understandable when the evidence is distributed intentionally across a connected sequence.
The key is that every post should add an intellectual function. Repeating the headline number in several forms may improve emphasis, but it does not improve understanding.
The First Post Still Has to Be Honest
Research threads create pressure to make the opener dramatic enough to earn the next click. That pressure does not justify a stronger claim.
Suppose a survey finds that 64% of 1,000 enterprise teams reported difficulty moving AI pilots into routine operations. A hook saying “Most AI projects fail” would broaden both the population and the outcome beyond what the hypothetical survey measured.
A more accurate opening could retain the tension without discarding the evidence: it might state that nearly two-thirds of the surveyed enterprise teams reported difficulty moving pilots into routine operations, then frame the thread around the question of why that transition is difficult.
The second version still creates curiosity. The difference is that the curiosity comes from the actual finding rather than from exaggerating the finding into a larger claim.
Threads Work Particularly Well for Contradictory Results
Some of the most useful research findings appear contradictory when reduced to a headline.
A report may show that greater automation is associated with lower average processing time while also being associated with higher exception-management costs. One short post could easily become either “automation saves time” or “automation creates hidden costs,” depending on which side the writer chooses to emphasize.
The opening can introduce the tension, later posts can explain how each result was measured, another can discuss plausible explanations, and the final post can translate the findings into a practical decision.
This is where format selection follows evidence structure rather than channel fashion. The thread is useful because the finding benefits from progressive resolution.
Newsletters Should Contextualize the Research, Not Merely Make the Summary Longer
A newsletter gives the writer much more room than a standard social post, but the additional space only matters if it is used for additional reasoning. Copying the executive summary into an email does not create a new editorial asset.
A stronger research newsletter starts with one meaningful question or finding, explains why the result matters, introduces the evidence, considers plausible interpretations, clarifies what the study cannot establish, and connects the result to a practical implication or future question. This format is especially useful when the research has competing explanations.
A survey may show that organizations with mature data governance report more successful AI deployments without establishing why. The newsletter can examine plausible mechanisms, compare the finding with other evidence, and explicitly distinguish those interpretations from what the survey itself demonstrated.
That distinction creates trust because the reader can see where the source ends and the publication’s analysis begins. The newsletter becomes more valuable than the research summary precisely because it adds context without pretending the added interpretation was part of the original study.
Newsletters Are Also Better for Conflicting Evidence
Research does not always produce one clean answer.
One study may find a positive effect, another may find little difference, and a third may produce a result only under a narrow condition. Social feeds encourage selection of the most dramatic finding, while newsletters provide enough space to explain why the evidence may disagree.
A strong edition can present the different findings, identify how the populations or methods differ, explain which conclusions remain defensible, and identify what evidence would help resolve the uncertainty. The publication is not simply republishing research; it is helping readers understand the structure of the evidence. This is particularly valuable for AI, ecommerce, software, and technology topics where product versions, benchmarks, datasets, and implementation conditions can change quickly enough that apparently conflicting results may all be accurate within their own contexts.
LinkedIn, X, and Newsletters Should Not Become Three Lengths of the Same Summary
A common AI workflow generates the LinkedIn post first, shortens it into an X thread, then expands it into a newsletter.
That is efficient at the production level and weak at the editorial level. Each channel should perform a different intellectual job.
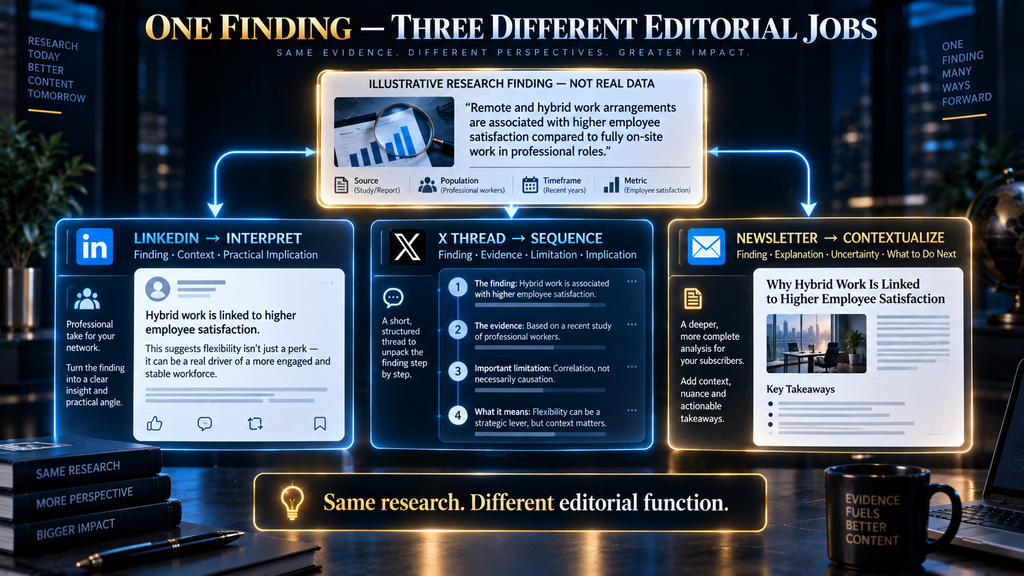
LinkedIn can interpret one decision-relevant result for a professional audience. X can sequence a surprising finding so the evidence unfolds logically. The newsletter can contextualize the result, examine competing explanations, introduce related research, and explore the uncertainty or implementation consequences in more depth.
The three assets may all begin from the same evidence atom while still delivering three genuinely different experiences.
This prevents the audience from encountering the same summary repeatedly and gives the research a longer useful life. A good distribution system therefore varies both format and editorial function.
Build a Research Portfolio Around Claim Roles
One report may contain ten findings but still produce a repetitive campaign if every asset performs the same job.
A stronger portfolio can distribute several intellectual roles across the source. One asset might communicate the headline finding, another might explain the mechanism or plausible explanation, another could focus on a contradiction, a fourth could teach the methodology, and another could surface the most important limitation or unanswered question.
This does not mean every report needs one asset for every role. The framework is useful because it forces the team to inspect idea diversity, not merely count how many posts have been drafted.
Five posts using different statistics can still feel repetitive if they all deliver the same message. Three assets can feel much richer when one explains what happened, another explains why the evidence matters, and the third examines where the conclusion stops applying.
The quality of the portfolio should therefore be judged by intellectual coverage rather than raw output quantity.
Give AI an Evidence-Bounded Brief
Once the evidence atom and destination are approved, AI becomes much more effective when given a tightly bounded brief.
The brief should identify the exact finding, intended audience, channel, editorial objective, Minimum Evidence Payload, material limitation, source attribution requirement, and any language the model must not strengthen. For an observational finding, for example, the instructions can explicitly prohibit causal verbs unless the source supports causal inference.
A LinkedIn brief might ask the model to preserve the population and study date, explain one practical implication, retain one important limitation, and produce a post that can be understood without forcing the reader to open the report. A thread brief might assign different evidence functions to different posts, while a newsletter brief might distinguish the research finding from the publication’s analysis and any outside evidence being added.
This approach is much stronger than telling the model to “write an engaging post.” The AI now knows not only what should become more readable, but also what it is not allowed to change. That reduces the amount of factual repair required later.
Use AI Again After Drafting — This Time as an Evidence-Loss Checker
AI should not disappear from the workflow after the first draft. One of its most useful second-pass roles is comparing the derivative against the approved evidence ledger. Provide the model with both documents and ask it to identify whether the population broadened, the timeframe disappeared, attribution was removed, certainty increased, an association became causal, a forecast became factual, a vendor claim became neutral research, or a new explanation appeared without source support.
This is not a substitute for human review because the same model can miss the same error twice. It is a practical error-detection layer that catches problems before the editor performs the final check.
The workflow becomes much stronger when AI is used on both sides of generation: first to structure the evidence and later to audit whether the transformation preserved that structure.
Do Not Let AI Invent the “Why”
Generative models are extremely good at completing missing explanations. That is useful in brainstorming and dangerous in research communication.
Suppose the source finds that companies with mature data governance also report higher AI deployment success. The model may confidently explain that these companies succeed because cleaner governed data improves model performance and reduces operational errors.
That explanation could be plausible. The study may never have tested it.
The finished content needs to distinguish three layers: what the research observed, what the publication interprets, and what remains only a plausible hypothesis.
A newsletter can explicitly explore several explanations. A LinkedIn post can say the pattern “may reflect” certain operational differences if that analysis is clearly labeled and responsibly reasoned.
What it should not do is convert a plausible mechanism into a research finding simply because the mechanism makes the post easier to understand.
Do Not Turn Every Finding Into Advice
Another common transformation happens when a descriptive result becomes a recommendation.
A survey might reveal that companies adopting a particular workflow report higher satisfaction. That finding alone may not justify telling every reader to adopt the workflow.
Does the evidence apply to the reader’s situation? What costs or trade-offs were not measured? Is there stronger evidence supporting the intervention? Could reverse causality or selection explain the relationship?
The research can inform a recommendation without automatically proving it. When the final asset includes advice that goes beyond what the source directly established, the publication should treat that recommendation as analysis rather than presenting it as though the researchers prescribed it. This distinction makes the article more useful because it allows practical interpretation without pretending that the evidence answered a question it never studied.
Visual Research Repurposing Requires Its Own Verification
Research does not become safer simply because the numbers are placed in a chart.
Visual design can alter interpretation through truncated axes, inconsistent scales, selective time ranges, missing baselines, unlabeled units, or omitted samples. A chart can therefore be numerically accurate and still create a misleading impression.
When research becomes a LinkedIn document, newsletter graphic, or social chart, the editor should verify the values, axis, labels, units, timeframe, comparison, sample, and source. If one of those elements materially affects the interpretation, it should remain visible or be explained in the surrounding copy.
AI-generated graphics create another risk because generative systems may invent intermediate datapoints, labels, or values to make a visualization look complete. The published visual should contain only data that actually exists in the source unless interpolation or estimation is explicitly identified.
A strong research workflow treats the visual as another derivative that must preserve the evidence relationship.
Freshness Is Different From Accuracy
A research finding can remain perfectly accurate and still become poor evidence for a current decision.
A 2022 survey of software adoption remains an accurate description of what respondents reported in 2022. It may no longer be useful evidence for a 2026 claim about the current AI-tool market.
That distinction is especially important in fast-changing topics such as AI capabilities, pricing, regulation, social platforms, ecommerce technology, and software benchmarks. The review process should therefore ask two separate questions: Was the source represented accurately? and Is the source still fresh enough for the conclusion being made now? When old evidence no longer supports a current recommendation, the correct action is not to hide the date.
It may be better to find newer evidence or update the underlying article before beginning another repurposing cycle. Research distribution should not become a mechanism for spreading yesterday’s truth faster.
A Worked Example: One Finding, Three Different Editorial Jobs
Consider a fictional survey created only to demonstrate the workflow. Assume that a September 2026 survey of 1,200 ecommerce operators across the United States, United Kingdom, and Australia found that 62% reported that inaccurate or incomplete catalog data had caused problems in their product-recommendation workflows during the previous twelve months.
This is an illustrative statistic, not a real research result, and it should never be reused outside the example as factual evidence.
The evidence ledger would classify the result as a self-reported survey finding. Its Minimum Evidence Payload would include the 1,200-person sample, ecommerce-operator population, three-country scope, September 2026 field period, 62% result, and the fact that the outcome was self-reported rather than independently measured.
A LinkedIn post could use the finding to challenge the assumption that recommendation quality is solely a model problem. It could explain that many of the fictional respondents reported issues at the catalog-data layer, then ask whether teams are evaluating product identity, attributes, variants, stock, and availability before replacing their AI system.
The post should not say that catalog problems caused 62% of recommendation failures. The fictional survey did not establish that.
An X thread could perform a different job by sequencing the evidence. The first post might introduce the 62% result, the next could identify the sample and markets, another could explain what “catalog-data problems” means operationally, a later post could state the survey limitation, and the final post could translate the finding into a practical diagnostic question.
The thread now provides an evidence journey rather than a shorter version of the LinkedIn copy.
A newsletter could go deeper by asking whether recommendation failures are really AI failures. It could introduce the fictional survey, explain several plausible catalog mechanisms, distinguish those mechanisms from what the survey directly measured, discuss what additional evidence would be required to establish causation, and finish with an operational checklist for evaluating the source of recommendation errors.
Same research finding. Three different editorial jobs. The value comes from interpretation, sequencing, and context rather than simply changing the length.
Measure Evidence Quality Alongside Content Performance
Research-derived content still needs to perform. LinkedIn posts can be evaluated through meaningful comments, saves, shares, profile activity, qualified clicks, and downstream actions; X threads can be assessed through thread interaction, reposts, replies, and relevant link behavior; newsletters can be evaluated through clicks, replies, subscriber actions, and conversions where those outcomes match the edition’s purpose.
Those metrics answer only one part of the question. Research repurposing also needs evidence-quality metrics.
A team can track unsupported claims detected during review, missing attribution, qualifiers restored by editors, causal-strength errors, stale sources, post-publication corrections, and drafts rejected because the evidence could not survive the proposed transformation. Those measures reveal whether AI is actually making the workflow more efficient.
If draft production rises while verification errors rise even faster, the system is not simply becoming more productive; it is moving work from writing into fact checking. The best workflow improves both publishable output and evidence integrity.
Reuse Usable Asset Yield Instead of Celebrating Draft Count
The broader AI Hustle World repurposing system uses Usable Asset Yield to compare approved publishable derivatives with total drafts generated. That metric is particularly useful for research because AI can produce impressive-looking drafts that collapse during evidence review.
If twelve research-derived posts are generated but only four survive verification without substantial rewriting, raw draft count tells the wrong story. A more disciplined workflow that generates six drafts and approves five may be operationally stronger despite producing fewer initial outputs.
Usable Asset Yield should not become a benchmark or quality target by itself.
The team must keep the approval standard stable, otherwise it could artificially improve the metric by publishing weaker work. Its purpose is to reveal whether better source extraction, claim classification, channel selection, and briefing are reducing wasted editorial effort.
Common Failure Patterns Should Be Treated as System Errors
Most research-repurposing mistakes are predictable enough to become explicit QA controls.
A statistic losing its population is not simply “bad copy”; it means the workflow failed to protect scope. A vendor disappearing from vendor research means provenance was not preserved, while a forecast becoming certainty means predictive status was dropped during compression.
Qualitative research presented as “most customers” indicates that method type was lost. A benchmark transformed into an overall winner indicates that test conditions disappeared, and a correlation rewritten with causal verbs indicates that claim strength was not controlled.
The same system logic applies to channel-specific failures. A thread that reads like an abstract split into six pieces means sequencing was never redesigned, while a newsletter that simply expands the social post means the editorial job never changed.
AI inventing a plausible explanation is another system error because the model was allowed to move from evidence into interpretation without a clear boundary.
These problems should not be fixed only through better wording after the fact. The upstream workflow should make them harder to create.
A Practical Research-to-Content Workflow
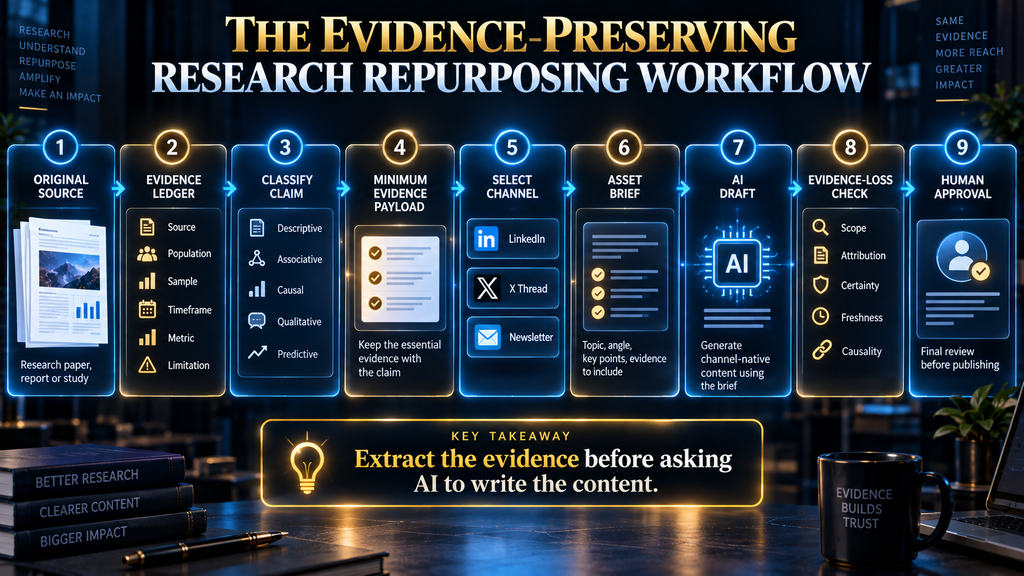
The complete process begins with the original research source rather than with the channel.
First, extract the evidence into a ledger and verify the findings worth distributing. Classify each claim as descriptive, comparative, associative, causal, predictive, qualitative, or another relevant type, then determine the Minimum Evidence Payload that has to survive for the claim to remain defensible.
Only after those decisions should the editor choose LinkedIn, X, a newsletter, or no derivative at all.
The next step is to define the editorial job. A LinkedIn post may interpret the finding, an X thread may sequence the evidence, while a newsletter may contextualize the result or compare competing explanations. AI then receives one evidence-bounded brief for one asset at a time.
After drafting, compare the derivative against the evidence ledger. Inspect changes in population, timeframe, attribution, certainty, causal language, comparison, source type, forecast status, and interpretation. Human approval comes after that comparison, not before.
Distribution and measurement complete the cycle, but the research source remains the canonical evidence record. Future derivatives should return to it rather than treating the latest social post as the new source of truth.
That workflow is slower than one mega-prompt. It is much faster than rebuilding trust after an inaccurate claim spreads across several channels.
A Decision Framework Before You Publish
Before publishing any research-derived asset, five decisions should be clear.
The first is what the source actually establishes. If the team cannot classify the claim accurately, it is not ready to transform it.
The second is what context cannot be removed. That is the Minimum Evidence Payload, and it should be defined before a hook or headline is written.
The third is which channel can carry that evidence naturally. A simple statistic may fit anywhere, while a complicated causal estimate or disputed forecast may require the space of a newsletter.
The fourth is what new editorial value the derivative adds. Interpretation, sequence, synthesis, practical application, or contextual explanation should justify publishing something new rather than merely repeating the report.
The fifth is whether the final asset still says what the research says. Compare the derivative to the original evidence, not to the previous derivative.
When those five decisions are handled explicitly, AI becomes a powerful research-distribution tool rather than an uncontrolled summarization layer.
Final Thoughts
Research repurposing is often described as a distribution problem: take one report, turn it into social posts, create a thread, send a newsletter, and extend the lifespan of the original work. AI makes that process dramatically faster, but faster transformation does not solve the hardest part.
The difficult question is what the evidence allows each derivative to say.
That is why the workflow should begin with an evidence ledger rather than a content prompt. Classify the finding, preserve its Minimum Evidence Payload, choose a channel capable of carrying that context, define the new editorial job, and only then allow AI to draft the asset.
The AI Hustle World Research-to-Channel Evidence Preservation Map provides the control layer for that decision. Descriptive statistics, survey findings, comparisons, correlations, causal estimates, benchmarks, qualitative themes, vendor studies, and forecasts have different evidence requirements, so they should not be compressed using the same rules.
LinkedIn works particularly well when one research finding needs professional interpretation. X threads can preserve context through evidence sequence, while newsletters provide the space required for uncertainty, synthesis, competing explanations, and deeper implications.
AI can make extraction, restructuring, drafting, and verification much faster. What it should not do is silently turn an association into causation, a sample into an industry, a forecast into a fact, a vendor claim into independent evidence, or a plausible explanation into a research finding.
Research Is Only One Type of Source — Want the Full Repurposing System?
See how to qualify any source, extract the ideas worth reusing, judge transformation distance, protect accuracy, and turn one strong source into multiple useful assets without multiplying weak content.
See the Complete AI Content Repurposing System →Frequently Asked Questions
How do I repurpose research with AI without losing accuracy?
Separate evidence extraction from content generation. Build an evidence ledger that records the claim, source, population, sample, timeframe, metric, comparison, evidence type, uncertainty, and material limitation, then verify that record before AI drafts any derivative.
How do I turn research into a LinkedIn post?
Choose one decision-relevant finding rather than summarizing the full report. Explain what the research found, preserve the context needed to interpret it, add a useful professional interpretation, and make important limitations visible when removing them would materially strengthen the conclusion.
How do I turn research into an X thread?
Design the thread around evidence sequence rather than character splitting. The opening can introduce the finding, while later posts establish the population or method, explain the result, surface an important limitation, and translate the evidence into a practical implication.
How do I turn a research report into a newsletter?
Begin with one meaningful finding or decision question rather than copying the executive summary. Use the additional space to explain why the result matters, what the evidence supports, what it does not establish, what other evidence says, and what implications the reader should investigate.
What is the Minimum Evidence Payload?
The Minimum Evidence Payload is the smallest set of contextual information that needs to remain attached to a research claim for its meaning to stay materially faithful during repurposing. Depending on the claim, this may include source, population, sample, timeframe, metric, comparator, study design, uncertainty, attribution, or forecast status.
How can I stop AI from turning correlation into causation?
Classify the finding before drafting and record its claim strength in the evidence ledger. Tell the model explicitly that associative language must remain associative and prohibit causal verbs unless the underlying design supports causal inference.
Should I communicate uncertainty on social media?
Yes when the uncertainty materially affects what the audience should believe. The goal is not to overload every post with technical qualifications, but to preserve uncertainty that changes the strength, generalizability, or reliability of the conclusion.
How should vendor research be repurposed?
Keep the provenance visible when it matters to interpretation. If a vendor conducted the survey or reported the customer result, the derivative should generally attribute the finding to that vendor instead of presenting the statistic as unidentified independent research.
Should every research finding become content for all three channels?
No. The Research-to-Channel Evidence Preservation Map deliberately allows conditional and unsuitable transformations because some claims require more context than a particular format can reasonably carry.
How do I measure whether research repurposing is successful?
Measure distribution performance and evidence quality separately. Engagement, saves, replies, clicks, newsletter actions, report visits, downloads, citations, and conversions can show whether the content is reaching and influencing the intended audience.
Related Guides
- Turn Video Transcripts Into Articles, Clips and Social Posts With AI
- 8 Best AI Content Repurposing Tools in 2026
- How to Build a Content Atom Workflow with AI
- How to Verify AI Information: A Practical Accuracy Framework
Written by
Muntasir Ahmad Chowdhury
Founder, AI Hustle World
Muntasir Ahmad Chowdhury is the Founder of AI Hustle World, an independent publication dedicated to making Artificial Intelligence practical, trustworthy, and easy to understand. He researches AI tools, automation, customer service, productivity, and real-world business applications, helping readers make smarter technology decisions through research-driven, experience-backed content.
Expertise:
AI Tools • AI Automation • AI Customer Service • AI Productivity • Generative AI • AI Workflows
Get Smarter With AI
Enjoyed this guide? Get practical AI tools, tutorials, and honest reviews delivered to your inbox.
2 thoughts on “How to Repurpose Research into LinkedIn Posts, X Threads and Newsletters”